Input interpretation

morphological components | actinolite (mineral) | image
Result

Result
Original image

Original image
Enriched analysis

Enriched analysis
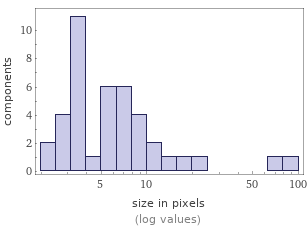
Component size distribution

Enriched analysis Component size distribution
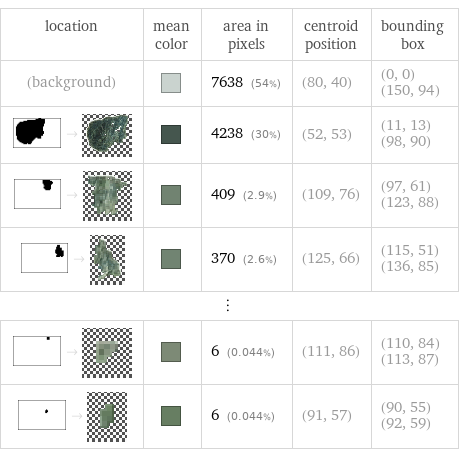
Components

location | mean color | area in pixels | centroid position | bounding box (background) | | 7638 (54%) | (80, 40) | (0, 0) (150, 94) -> | | 4238 (30%) | (52, 53) | (11, 13) (98, 90) -> | | 409 (2.9%) | (109, 76) | (97, 61) (123, 88) -> | | 370 (2.6%) | (125, 66) | (115, 51) (136, 85) ⋮ | | | | -> | | 6 (0.044%) | (111, 86) | (110, 84) (113, 87) -> | | 6 (0.044%) | (91, 57) | (90, 55) (92, 59)