Input interpretation

group 4 elements | melting point
Results

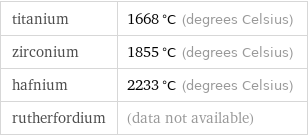
titanium | 1668 °C (degrees Celsius) zirconium | 1855 °C (degrees Celsius) hafnium | 2233 °C (degrees Celsius) rutherfordium | (data not available)

group 4 elements | melting point | 1855 °C (degrees Celsius) (median) (based on 3 values; 1 unavailable)
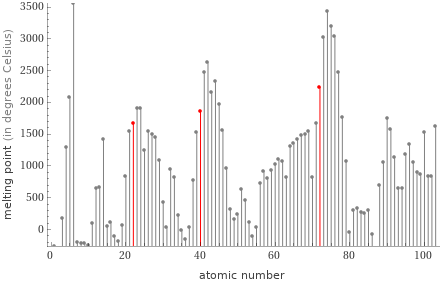
Plot

Plot
Unit conversions for median melting point 1855 °C

2128 K (kelvins)

3371 °F (degrees Fahrenheit)

3831 °R (degrees Rankine)

1484 °Ré (degrees Réaumur)

981.4 °Rø (degrees Rømer)
Comparison for median melting point 1855 °C

190 °C below temperature of a hydrogen flame (2320 K)

187 °C above melting point of titanium (1668 °C)
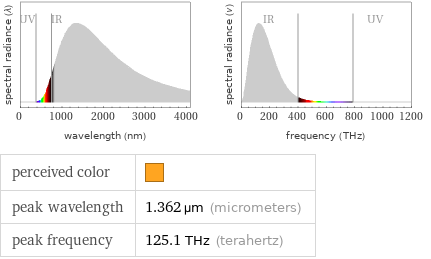
Blackbody information for median melting point 1855 °C (degrees Celsius)

perceived color | peak wavelength | 1.362 µm (micrometers) peak frequency | 125.1 THz (terahertz)
Corresponding quantities

Thermodynamic energy E from E = kT: | 18 ceV (centielectronvolts)

Blackbody energy flux Φ from Φ = σT^4: | 1.163×10^6 W/m^2 (watts per square meter)

Approximate luminous exitance from a planar blackbody radiator perpendicular to its surface: | 3.079×10^6 lx (lux)
Thermodynamic properties

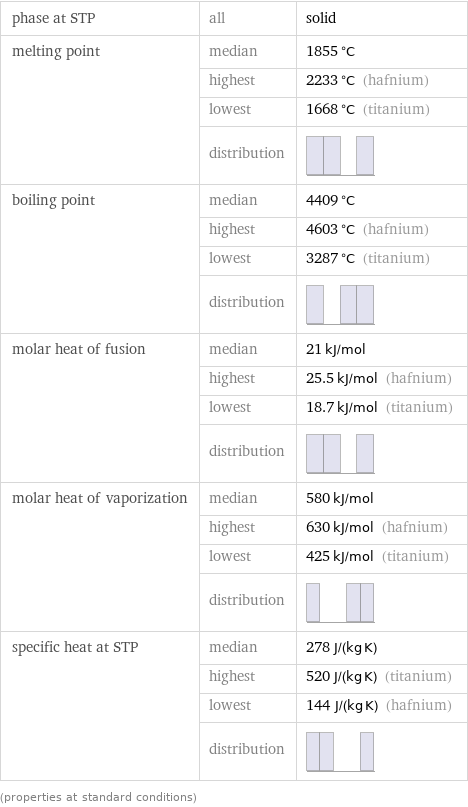
phase at STP | all | solid melting point | median | 1855 °C | highest | 2233 °C (hafnium) | lowest | 1668 °C (titanium) | distribution | boiling point | median | 4409 °C | highest | 4603 °C (hafnium) | lowest | 3287 °C (titanium) | distribution | molar heat of fusion | median | 21 kJ/mol | highest | 25.5 kJ/mol (hafnium) | lowest | 18.7 kJ/mol (titanium) | distribution | molar heat of vaporization | median | 580 kJ/mol | highest | 630 kJ/mol (hafnium) | lowest | 425 kJ/mol (titanium) | distribution | specific heat at STP | median | 278 J/(kg K) | highest | 520 J/(kg K) (titanium) | lowest | 144 J/(kg K) (hafnium) | distribution | (properties at standard conditions)