Input interpretation

amino acids | isoelectric point
Summary

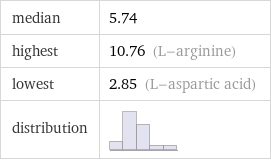
median | 5.74 highest | 10.76 (L-arginine) lowest | 2.85 (L-aspartic acid) distribution |
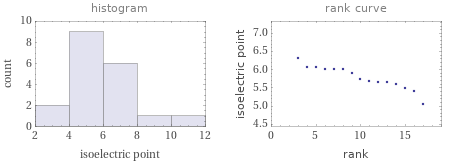
Distribution plots

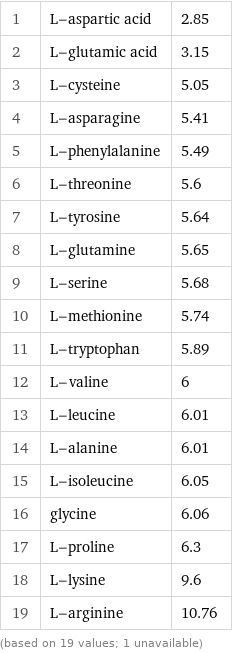
Isoelectric point rankings

1 | L-aspartic acid | 2.85 2 | L-glutamic acid | 3.15 3 | L-cysteine | 5.05 4 | L-asparagine | 5.41 5 | L-phenylalanine | 5.49 6 | L-threonine | 5.6 7 | L-tyrosine | 5.64 8 | L-glutamine | 5.65 9 | L-serine | 5.68 10 | L-methionine | 5.74 11 | L-tryptophan | 5.89 12 | L-valine | 6 13 | L-leucine | 6.01 14 | L-alanine | 6.01 15 | L-isoleucine | 6.05 16 | glycine | 6.06 17 | L-proline | 6.3 18 | L-lysine | 9.6 19 | L-arginine | 10.76 (based on 19 values; 1 unavailable)