Input interpretation

morphological components | osmium | image
Result

Result
Original image
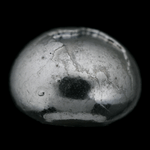
Original image
Enriched analysis
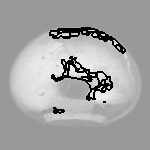
Enriched analysis
Component size distribution
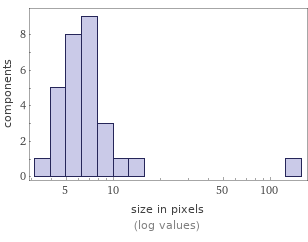
Enriched analysis Component size distribution
Components
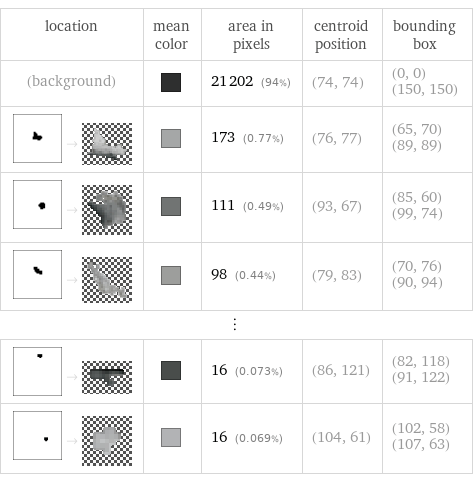
location | mean color | area in pixels | centroid position | bounding box (background) | | 21202 (94%) | (74, 74) | (0, 0) (150, 150) -> | | 173 (0.77%) | (76, 77) | (65, 70) (89, 89) -> | | 111 (0.49%) | (93, 67) | (85, 60) (99, 74) -> | | 98 (0.44%) | (79, 83) | (70, 76) (90, 94) ⋮ | | | | -> | | 16 (0.073%) | (86, 121) | (82, 118) (91, 122) -> | | 16 (0.069%) | (104, 61) | (102, 58) (107, 63)