Search

indium vs nihonium vs aluminum vs gallium vs thallium vs livermorium vs tin

Input interpretation

indium (chemical element) | nihonium (chemical element) | aluminum (chemical element) | gallium (chemical element) | thallium (chemical element) | livermorium (chemical element) | tin (chemical element)

Periodic table location
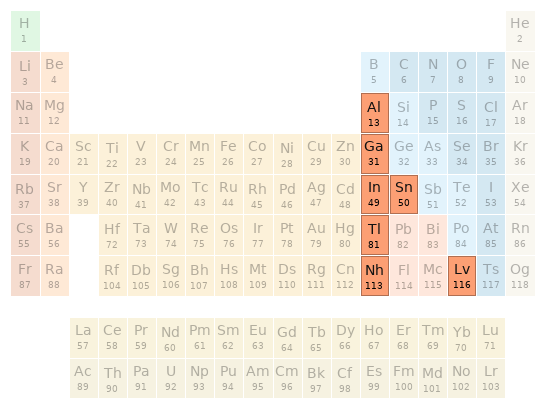
Periodic table location

Images
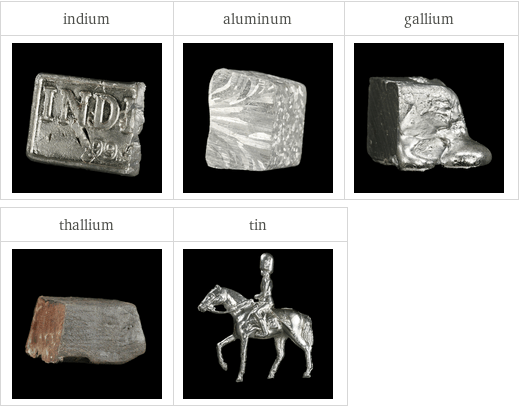
Images
Images

Basic elemental properties
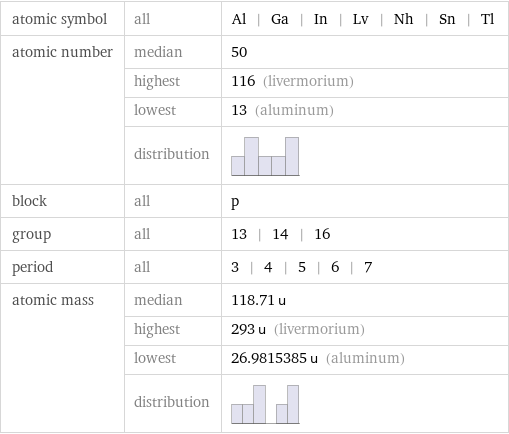
atomic symbol | all | Al | Ga | In | Lv | Nh | Sn | Tl atomic number | median | 50  | highest | 116 (livermorium)  | lowest | 13 (aluminum)  | distribution |  block | all | p group | all | 13 | 14 | 16 period | all | 3 | 4 | 5 | 6 | 7 atomic mass | median | 118.71 u  | highest | 293 u (livermorium)  | lowest | 26.9815385 u (aluminum)  | distribution |
atomic symbol | all | Al | Ga | In | Lv | Nh | Sn | Tl atomic number | median | 50 | highest | 116 (livermorium) | lowest | 13 (aluminum) | distribution | block | all | p group | all | 13 | 14 | 16 period | all | 3 | 4 | 5 | 6 | 7 atomic mass | median | 118.71 u | highest | 293 u (livermorium) | lowest | 26.9815385 u (aluminum) | distribution |

Thermodynamic properties
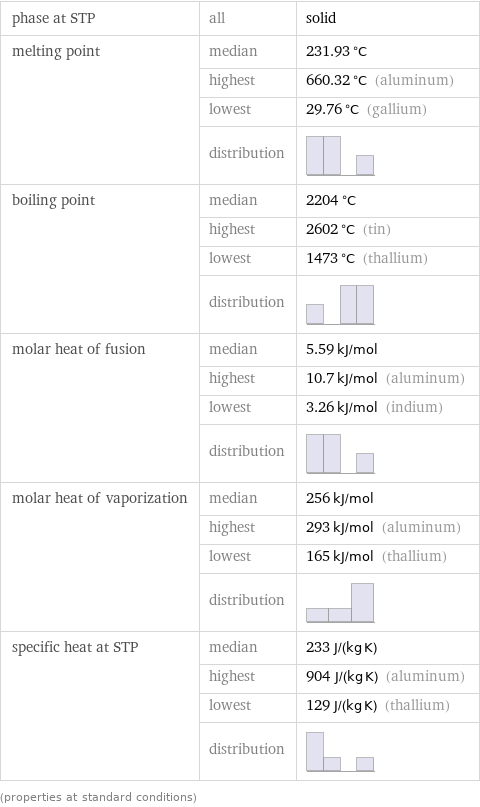
phase at STP | all | solid melting point | median | 231.93 °C  | highest | 660.32 °C (aluminum)  | lowest | 29.76 °C (gallium)  | distribution |  boiling point | median | 2204 °C  | highest | 2602 °C (tin)  | lowest | 1473 °C (thallium)  | distribution |  molar heat of fusion | median | 5.59 kJ/mol  | highest | 10.7 kJ/mol (aluminum)  | lowest | 3.26 kJ/mol (indium)  | distribution |  molar heat of vaporization | median | 256 kJ/mol  | highest | 293 kJ/mol (aluminum)  | lowest | 165 kJ/mol (thallium)  | distribution |  specific heat at STP | median | 233 J/(kg K)  | highest | 904 J/(kg K) (aluminum)  | lowest | 129 J/(kg K) (thallium)  | distribution |  (properties at standard conditions)
phase at STP | all | solid melting point | median | 231.93 °C | highest | 660.32 °C (aluminum) | lowest | 29.76 °C (gallium) | distribution | boiling point | median | 2204 °C | highest | 2602 °C (tin) | lowest | 1473 °C (thallium) | distribution | molar heat of fusion | median | 5.59 kJ/mol | highest | 10.7 kJ/mol (aluminum) | lowest | 3.26 kJ/mol (indium) | distribution | molar heat of vaporization | median | 256 kJ/mol | highest | 293 kJ/mol (aluminum) | lowest | 165 kJ/mol (thallium) | distribution | specific heat at STP | median | 233 J/(kg K) | highest | 904 J/(kg K) (aluminum) | lowest | 129 J/(kg K) (thallium) | distribution | (properties at standard conditions)

Material properties

density | median | 7.31 g/cm^3  | highest | 11.85 g/cm^3 (thallium)  | lowest | 2.7 g/cm^3 (aluminum)  | distribution |  liquid density | median | 6.99 g/cm^3  | highest | 11.22 g/cm^3 (thallium)  | lowest | 2.375 g/cm^3 (aluminum)  | distribution |  molar volume | median | 15.71 cm^3/mol  | highest | 17.247 cm^3/mol (thallium)  | lowest | 10 cm^3/mol (aluminum)  | distribution |  Mohs hardness | median | 1.5  | highest | 2.75 (between calcite and gypsum) (aluminum)  | lowest | 1.2 (between talc and gypsum) (indium and thallium)  | distribution |  Vickers hardness | all | 167 MPa Brinell hardness | all | 8.83 MPa | 26.4 MPa | 51 MPa | 60 MPa | 245 MPa bulk modulus | median | 58 GPa  | highest | 76 GPa (aluminum)  | lowest | 43 GPa (thallium)  | distribution |  shear modulus | median | 18 GPa  | highest | 26 GPa (aluminum)  | lowest | 2.8 GPa (thallium)  | distribution |  Young's modulus | median | 31 GPa  | highest | 70 GPa (aluminum)  | lowest | 8 GPa (thallium)  | distribution |  Poisson ratio | all | 0.35 | 0.36 | 0.45 ultimate tensile strength | all | 4 MPa | 7 MPa | 220 MPa sound speed | median | 2500 m/s  | highest | 5100 m/s (aluminum)  | lowest | 818 m/s (thallium)  | distribution |  thermal expansion | median | 2.99×10^-5 K^(-1)  | highest | 1.2×10^-4 K^(-1) (gallium)  | lowest | 2.2×10^-5 K^(-1) (tin)  | distribution |  thermal conductivity | median | 67 W/(m K)  | highest | 235 W/(m K) (aluminum)  | lowest | 29 W/(m K) (gallium)  | distribution |  (properties at standard conditions)
density | median | 7.31 g/cm^3 | highest | 11.85 g/cm^3 (thallium) | lowest | 2.7 g/cm^3 (aluminum) | distribution | liquid density | median | 6.99 g/cm^3 | highest | 11.22 g/cm^3 (thallium) | lowest | 2.375 g/cm^3 (aluminum) | distribution | molar volume | median | 15.71 cm^3/mol | highest | 17.247 cm^3/mol (thallium) | lowest | 10 cm^3/mol (aluminum) | distribution | Mohs hardness | median | 1.5 | highest | 2.75 (between calcite and gypsum) (aluminum) | lowest | 1.2 (between talc and gypsum) (indium and thallium) | distribution | Vickers hardness | all | 167 MPa Brinell hardness | all | 8.83 MPa | 26.4 MPa | 51 MPa | 60 MPa | 245 MPa bulk modulus | median | 58 GPa | highest | 76 GPa (aluminum) | lowest | 43 GPa (thallium) | distribution | shear modulus | median | 18 GPa | highest | 26 GPa (aluminum) | lowest | 2.8 GPa (thallium) | distribution | Young's modulus | median | 31 GPa | highest | 70 GPa (aluminum) | lowest | 8 GPa (thallium) | distribution | Poisson ratio | all | 0.35 | 0.36 | 0.45 ultimate tensile strength | all | 4 MPa | 7 MPa | 220 MPa sound speed | median | 2500 m/s | highest | 5100 m/s (aluminum) | lowest | 818 m/s (thallium) | distribution | thermal expansion | median | 2.99×10^-5 K^(-1) | highest | 1.2×10^-4 K^(-1) (gallium) | lowest | 2.2×10^-5 K^(-1) (tin) | distribution | thermal conductivity | median | 67 W/(m K) | highest | 235 W/(m K) (aluminum) | lowest | 29 W/(m K) (gallium) | distribution | (properties at standard conditions)

Electromagnetic properties
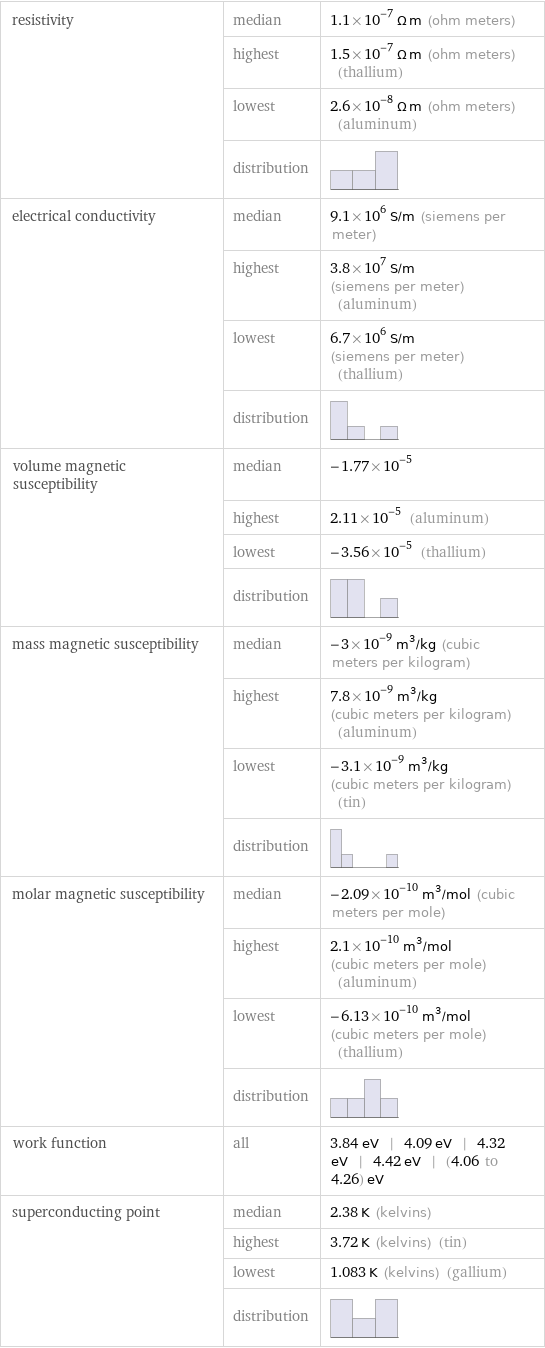
resistivity | median | 1.1×10^-7 Ω m (ohm meters)  | highest | 1.5×10^-7 Ω m (ohm meters) (thallium)  | lowest | 2.6×10^-8 Ω m (ohm meters) (aluminum)  | distribution |  electrical conductivity | median | 9.1×10^6 S/m (siemens per meter)  | highest | 3.8×10^7 S/m (siemens per meter) (aluminum)  | lowest | 6.7×10^6 S/m (siemens per meter) (thallium)  | distribution |  volume magnetic susceptibility | median | -1.77×10^-5  | highest | 2.11×10^-5 (aluminum)  | lowest | -3.56×10^-5 (thallium)  | distribution |  mass magnetic susceptibility | median | -3×10^-9 m^3/kg (cubic meters per kilogram)  | highest | 7.8×10^-9 m^3/kg (cubic meters per kilogram) (aluminum)  | lowest | -3.1×10^-9 m^3/kg (cubic meters per kilogram) (tin)  | distribution |  molar magnetic susceptibility | median | -2.09×10^-10 m^3/mol (cubic meters per mole)  | highest | 2.1×10^-10 m^3/mol (cubic meters per mole) (aluminum)  | lowest | -6.13×10^-10 m^3/mol (cubic meters per mole) (thallium)  | distribution |  work function | all | 3.84 eV | 4.09 eV | 4.32 eV | 4.42 eV | (4.06 to 4.26) eV superconducting point | median | 2.38 K (kelvins)  | highest | 3.72 K (kelvins) (tin)  | lowest | 1.083 K (kelvins) (gallium)  | distribution |
resistivity | median | 1.1×10^-7 Ω m (ohm meters) | highest | 1.5×10^-7 Ω m (ohm meters) (thallium) | lowest | 2.6×10^-8 Ω m (ohm meters) (aluminum) | distribution | electrical conductivity | median | 9.1×10^6 S/m (siemens per meter) | highest | 3.8×10^7 S/m (siemens per meter) (aluminum) | lowest | 6.7×10^6 S/m (siemens per meter) (thallium) | distribution | volume magnetic susceptibility | median | -1.77×10^-5 | highest | 2.11×10^-5 (aluminum) | lowest | -3.56×10^-5 (thallium) | distribution | mass magnetic susceptibility | median | -3×10^-9 m^3/kg (cubic meters per kilogram) | highest | 7.8×10^-9 m^3/kg (cubic meters per kilogram) (aluminum) | lowest | -3.1×10^-9 m^3/kg (cubic meters per kilogram) (tin) | distribution | molar magnetic susceptibility | median | -2.09×10^-10 m^3/mol (cubic meters per mole) | highest | 2.1×10^-10 m^3/mol (cubic meters per mole) (aluminum) | lowest | -6.13×10^-10 m^3/mol (cubic meters per mole) (thallium) | distribution | work function | all | 3.84 eV | 4.09 eV | 4.32 eV | 4.42 eV | (4.06 to 4.26) eV superconducting point | median | 2.38 K (kelvins) | highest | 3.72 K (kelvins) (tin) | lowest | 1.083 K (kelvins) (gallium) | distribution |

Reactivity
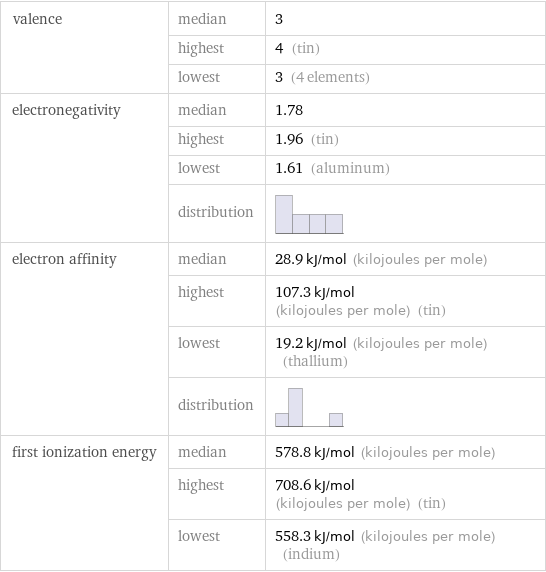
valence | median | 3  | highest | 4 (tin)  | lowest | 3 (4 elements) electronegativity | median | 1.78  | highest | 1.96 (tin)  | lowest | 1.61 (aluminum)  | distribution |  electron affinity | median | 28.9 kJ/mol (kilojoules per mole)  | highest | 107.3 kJ/mol (kilojoules per mole) (tin)  | lowest | 19.2 kJ/mol (kilojoules per mole) (thallium)  | distribution |  first ionization energy | median | 578.8 kJ/mol (kilojoules per mole)  | highest | 708.6 kJ/mol (kilojoules per mole) (tin)  | lowest | 558.3 kJ/mol (kilojoules per mole) (indium)
valence | median | 3 | highest | 4 (tin) | lowest | 3 (4 elements) electronegativity | median | 1.78 | highest | 1.96 (tin) | lowest | 1.61 (aluminum) | distribution | electron affinity | median | 28.9 kJ/mol (kilojoules per mole) | highest | 107.3 kJ/mol (kilojoules per mole) (tin) | lowest | 19.2 kJ/mol (kilojoules per mole) (thallium) | distribution | first ionization energy | median | 578.8 kJ/mol (kilojoules per mole) | highest | 708.6 kJ/mol (kilojoules per mole) (tin) | lowest | 558.3 kJ/mol (kilojoules per mole) (indium)

Atomic properties
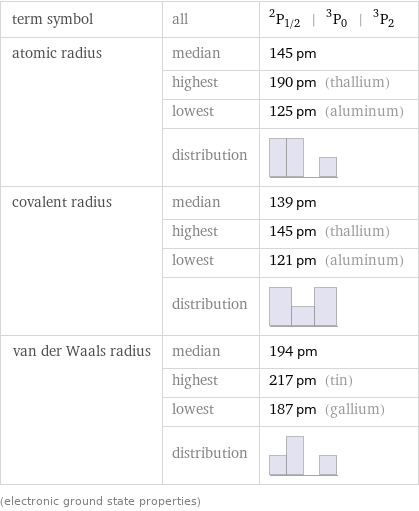
term symbol | all | ^2P_(1/2) | ^3P_0 | ^3P_2 atomic radius | median | 145 pm  | highest | 190 pm (thallium)  | lowest | 125 pm (aluminum)  | distribution |  covalent radius | median | 139 pm  | highest | 145 pm (thallium)  | lowest | 121 pm (aluminum)  | distribution |  van der Waals radius | median | 194 pm  | highest | 217 pm (tin)  | lowest | 187 pm (gallium)  | distribution |  (electronic ground state properties)
term symbol | all | ^2P_(1/2) | ^3P_0 | ^3P_2 atomic radius | median | 145 pm | highest | 190 pm (thallium) | lowest | 125 pm (aluminum) | distribution | covalent radius | median | 139 pm | highest | 145 pm (thallium) | lowest | 121 pm (aluminum) | distribution | van der Waals radius | median | 194 pm | highest | 217 pm (tin) | lowest | 187 pm (gallium) | distribution | (electronic ground state properties)

Abundances
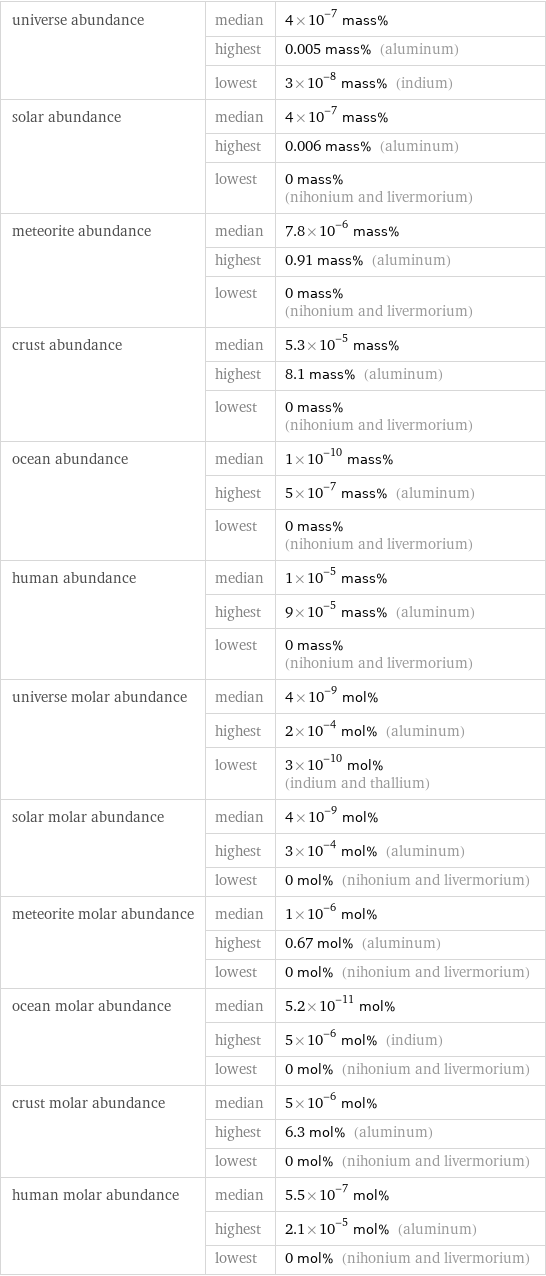
universe abundance | median | 4×10^-7 mass%  | highest | 0.005 mass% (aluminum)  | lowest | 3×10^-8 mass% (indium) solar abundance | median | 4×10^-7 mass%  | highest | 0.006 mass% (aluminum)  | lowest | 0 mass% (nihonium and livermorium) meteorite abundance | median | 7.8×10^-6 mass%  | highest | 0.91 mass% (aluminum)  | lowest | 0 mass% (nihonium and livermorium) crust abundance | median | 5.3×10^-5 mass%  | highest | 8.1 mass% (aluminum)  | lowest | 0 mass% (nihonium and livermorium) ocean abundance | median | 1×10^-10 mass%  | highest | 5×10^-7 mass% (aluminum)  | lowest | 0 mass% (nihonium and livermorium) human abundance | median | 1×10^-5 mass%  | highest | 9×10^-5 mass% (aluminum)  | lowest | 0 mass% (nihonium and livermorium) universe molar abundance | median | 4×10^-9 mol%  | highest | 2×10^-4 mol% (aluminum)  | lowest | 3×10^-10 mol% (indium and thallium) solar molar abundance | median | 4×10^-9 mol%  | highest | 3×10^-4 mol% (aluminum)  | lowest | 0 mol% (nihonium and livermorium) meteorite molar abundance | median | 1×10^-6 mol%  | highest | 0.67 mol% (aluminum)  | lowest | 0 mol% (nihonium and livermorium) ocean molar abundance | median | 5.2×10^-11 mol%  | highest | 5×10^-6 mol% (indium)  | lowest | 0 mol% (nihonium and livermorium) crust molar abundance | median | 5×10^-6 mol%  | highest | 6.3 mol% (aluminum)  | lowest | 0 mol% (nihonium and livermorium) human molar abundance | median | 5.5×10^-7 mol%  | highest | 2.1×10^-5 mol% (aluminum)  | lowest | 0 mol% (nihonium and livermorium)
universe abundance | median | 4×10^-7 mass% | highest | 0.005 mass% (aluminum) | lowest | 3×10^-8 mass% (indium) solar abundance | median | 4×10^-7 mass% | highest | 0.006 mass% (aluminum) | lowest | 0 mass% (nihonium and livermorium) meteorite abundance | median | 7.8×10^-6 mass% | highest | 0.91 mass% (aluminum) | lowest | 0 mass% (nihonium and livermorium) crust abundance | median | 5.3×10^-5 mass% | highest | 8.1 mass% (aluminum) | lowest | 0 mass% (nihonium and livermorium) ocean abundance | median | 1×10^-10 mass% | highest | 5×10^-7 mass% (aluminum) | lowest | 0 mass% (nihonium and livermorium) human abundance | median | 1×10^-5 mass% | highest | 9×10^-5 mass% (aluminum) | lowest | 0 mass% (nihonium and livermorium) universe molar abundance | median | 4×10^-9 mol% | highest | 2×10^-4 mol% (aluminum) | lowest | 3×10^-10 mol% (indium and thallium) solar molar abundance | median | 4×10^-9 mol% | highest | 3×10^-4 mol% (aluminum) | lowest | 0 mol% (nihonium and livermorium) meteorite molar abundance | median | 1×10^-6 mol% | highest | 0.67 mol% (aluminum) | lowest | 0 mol% (nihonium and livermorium) ocean molar abundance | median | 5.2×10^-11 mol% | highest | 5×10^-6 mol% (indium) | lowest | 0 mol% (nihonium and livermorium) crust molar abundance | median | 5×10^-6 mol% | highest | 6.3 mol% (aluminum) | lowest | 0 mol% (nihonium and livermorium) human molar abundance | median | 5.5×10^-7 mol% | highest | 2.1×10^-5 mol% (aluminum) | lowest | 0 mol% (nihonium and livermorium)