Input interpretation

group summary | anions | molar mass
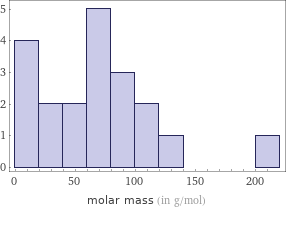
Histogram of values

Histogram of values
Statistics
Location

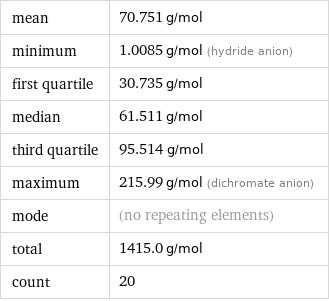
mean | 70.751 g/mol minimum | 1.0085 g/mol (hydride anion) first quartile | 30.735 g/mol median | 61.511 g/mol third quartile | 95.514 g/mol maximum | 215.99 g/mol (dichromate anion) mode | (no repeating elements) total | 1415.0 g/mol count | 20
Dispersion

sample standard deviation | 49.916 g/mol sample variance | 2492 g^2/mol^2 (grams squared per mole squared) interquartile range | 64.780 g/mol sample range | 214.98 g/mol coefficient of variation | 0.706
Shape

skewness | 1.1 kurtosis | 4.63