Input interpretation

Result

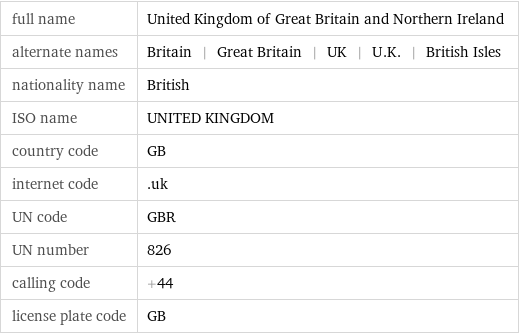
Name
Flag

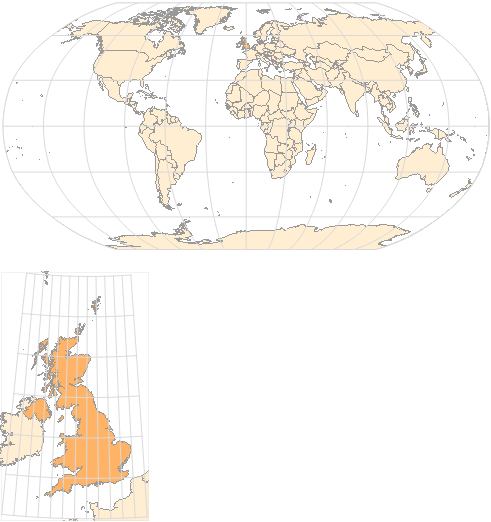
Location
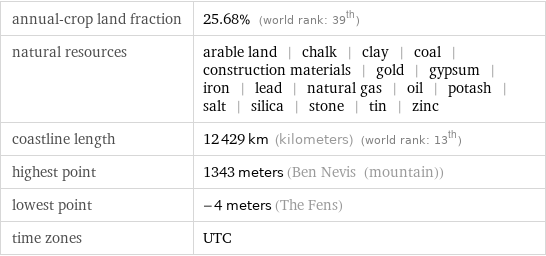
Geographic properties
Bordering country/region
Dependencies

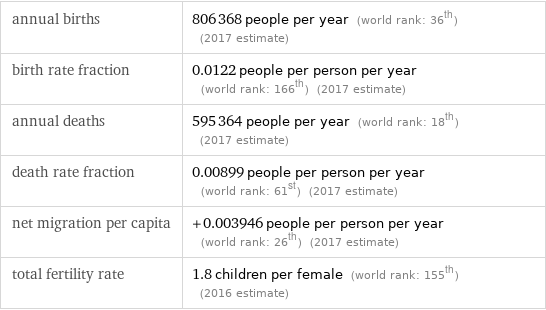
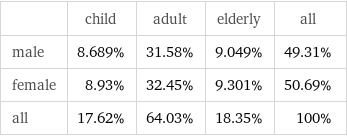
Demographics
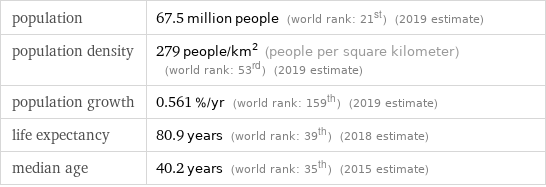
Rates
Distribution
Cultural properties
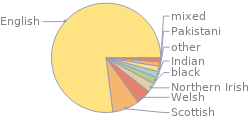
Ethnic mix
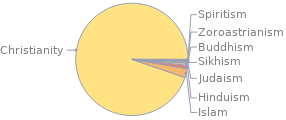
Religions
Capital city

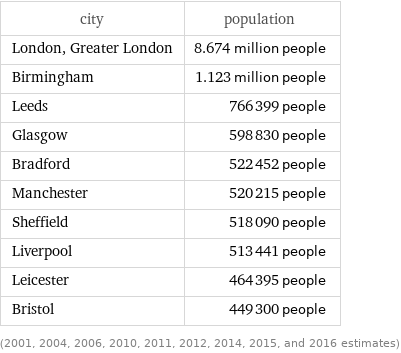
Largest cities
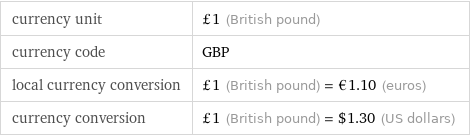
Currency
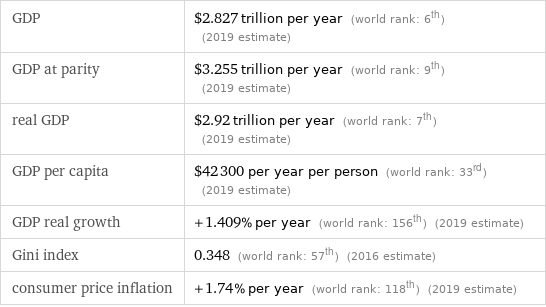
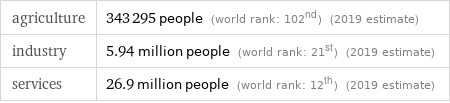
Economic properties
Employment
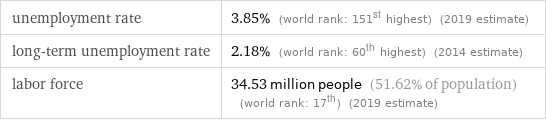
Labor force information
Employment information
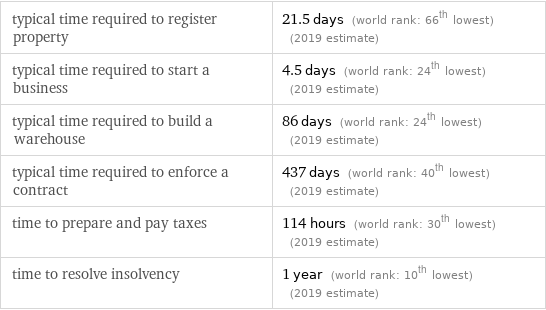
Business information
Business taxes

Business statistics

Business operating costs

Business procedures
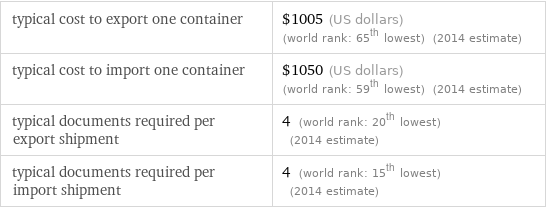
Trade facilitation
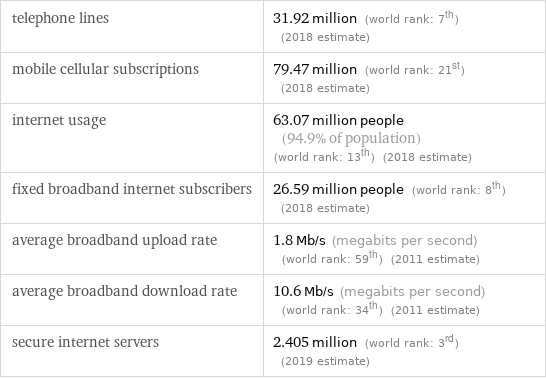
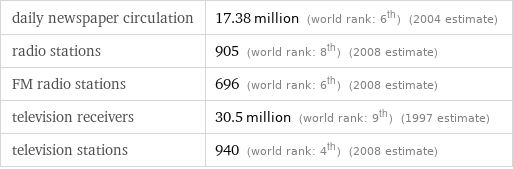
Media and telecommunications
Telecommunications information
Media information
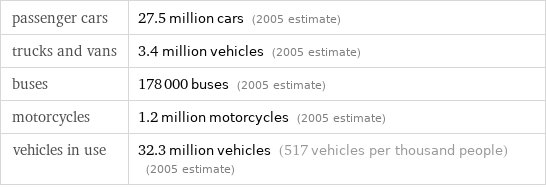
Transportation
Vehicles in use
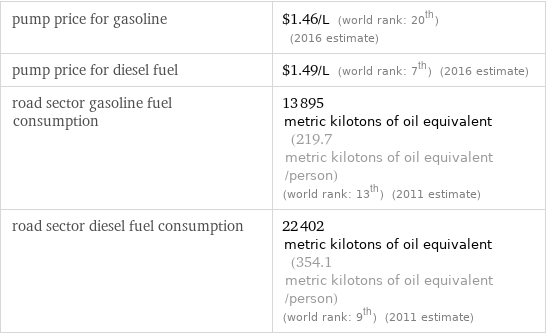
Fuel information
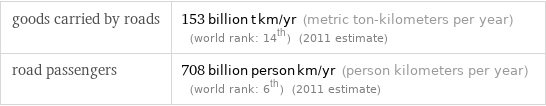
Road network
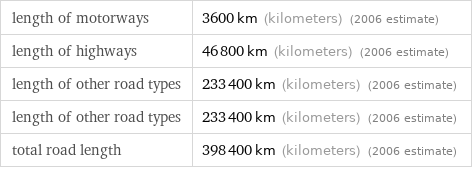
Road transport
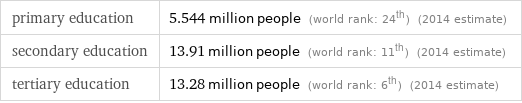
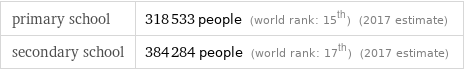
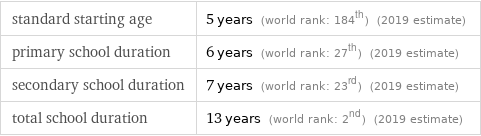
Education
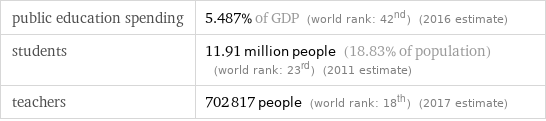
Students

Teachers
Duration of educational stages
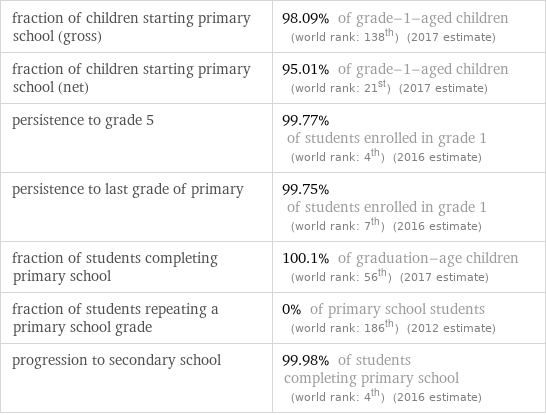
Education flow
Health care