Input interpretation

zirconium (chemical element) | palladium (chemical element) | yttrium (chemical element) | niobium (chemical element)
Periodic table location
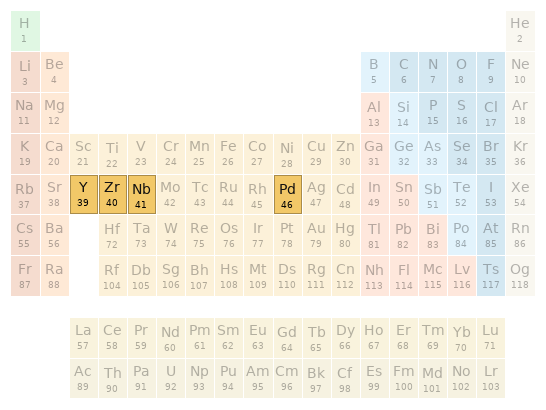
Periodic table location
Images
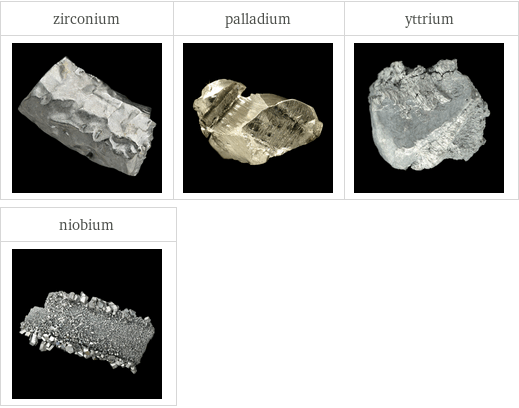
Images
Basic elemental properties
![| atomic symbol | atomic number | short electronic configuration zirconium | Zr | 40 | [Kr]5s^24d^2 palladium | Pd | 46 | [Kr]4d^10 yttrium | Y | 39 | [Kr]5s^24d^1 niobium | Nb | 41 | [Kr]5s^14d^4 | Aufbau diagram | block | group zirconium | 4d 5s | d | 4 palladium | 4d | d | 10 yttrium | 4d 5s | d | 3 niobium | 4d 5s | d | 5 | period | atomic mass | half-life zirconium | 5 | 91.224 u | (stable) palladium | 5 | 106.42 u | (stable) yttrium | 5 | 88.90584 u | (stable) niobium | 5 | 92.90637 u | (stable)](../image_source/c45505084dedb9f22fa6b06a329050f2.png)
| atomic symbol | atomic number | short electronic configuration zirconium | Zr | 40 | [Kr]5s^24d^2 palladium | Pd | 46 | [Kr]4d^10 yttrium | Y | 39 | [Kr]5s^24d^1 niobium | Nb | 41 | [Kr]5s^14d^4 | Aufbau diagram | block | group zirconium | 4d 5s | d | 4 palladium | 4d | d | 10 yttrium | 4d 5s | d | 3 niobium | 4d 5s | d | 5 | period | atomic mass | half-life zirconium | 5 | 91.224 u | (stable) palladium | 5 | 106.42 u | (stable) yttrium | 5 | 88.90584 u | (stable) niobium | 5 | 92.90637 u | (stable)
Thermodynamic properties
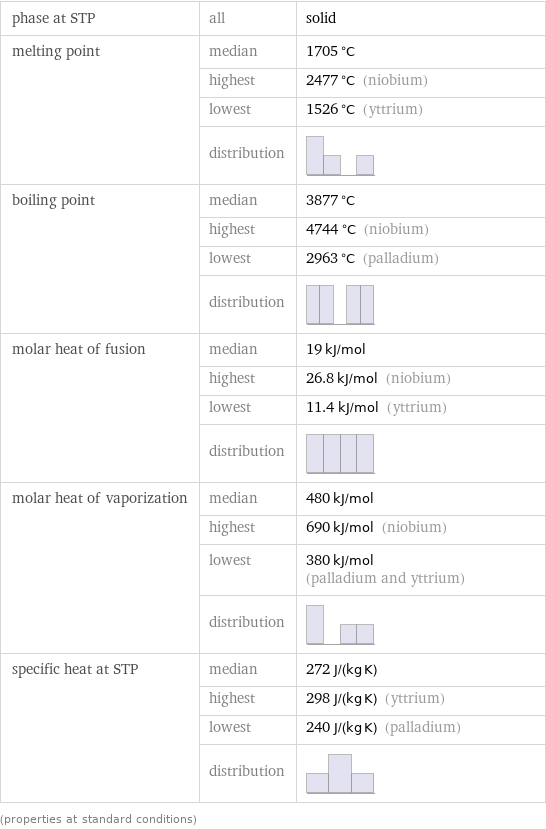
phase at STP | all | solid melting point | median | 1705 °C | highest | 2477 °C (niobium) | lowest | 1526 °C (yttrium) | distribution | boiling point | median | 3877 °C | highest | 4744 °C (niobium) | lowest | 2963 °C (palladium) | distribution | molar heat of fusion | median | 19 kJ/mol | highest | 26.8 kJ/mol (niobium) | lowest | 11.4 kJ/mol (yttrium) | distribution | molar heat of vaporization | median | 480 kJ/mol | highest | 690 kJ/mol (niobium) | lowest | 380 kJ/mol (palladium and yttrium) | distribution | specific heat at STP | median | 272 J/(kg K) | highest | 298 J/(kg K) (yttrium) | lowest | 240 J/(kg K) (palladium) | distribution | (properties at standard conditions)
Material properties
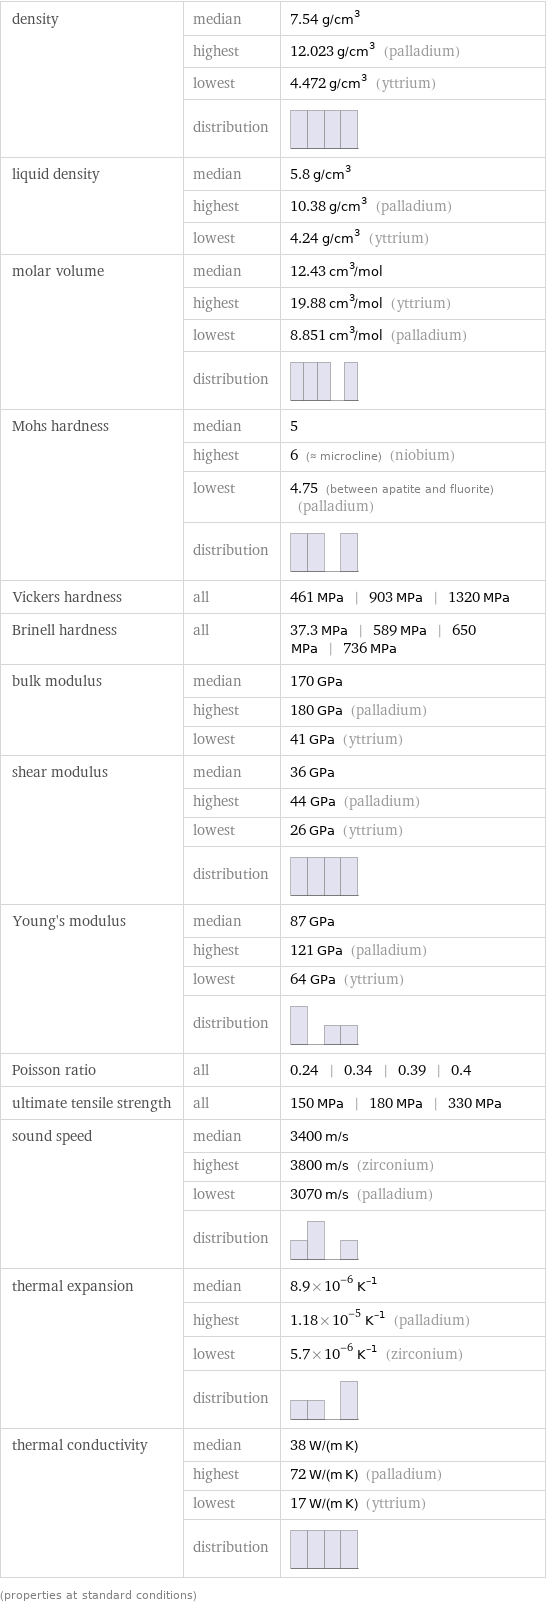
density | median | 7.54 g/cm^3 | highest | 12.023 g/cm^3 (palladium) | lowest | 4.472 g/cm^3 (yttrium) | distribution | liquid density | median | 5.8 g/cm^3 | highest | 10.38 g/cm^3 (palladium) | lowest | 4.24 g/cm^3 (yttrium) molar volume | median | 12.43 cm^3/mol | highest | 19.88 cm^3/mol (yttrium) | lowest | 8.851 cm^3/mol (palladium) | distribution | Mohs hardness | median | 5 | highest | 6 (≈ microcline) (niobium) | lowest | 4.75 (between apatite and fluorite) (palladium) | distribution | Vickers hardness | all | 461 MPa | 903 MPa | 1320 MPa Brinell hardness | all | 37.3 MPa | 589 MPa | 650 MPa | 736 MPa bulk modulus | median | 170 GPa | highest | 180 GPa (palladium) | lowest | 41 GPa (yttrium) shear modulus | median | 36 GPa | highest | 44 GPa (palladium) | lowest | 26 GPa (yttrium) | distribution | Young's modulus | median | 87 GPa | highest | 121 GPa (palladium) | lowest | 64 GPa (yttrium) | distribution | Poisson ratio | all | 0.24 | 0.34 | 0.39 | 0.4 ultimate tensile strength | all | 150 MPa | 180 MPa | 330 MPa sound speed | median | 3400 m/s | highest | 3800 m/s (zirconium) | lowest | 3070 m/s (palladium) | distribution | thermal expansion | median | 8.9×10^-6 K^(-1) | highest | 1.18×10^-5 K^(-1) (palladium) | lowest | 5.7×10^-6 K^(-1) (zirconium) | distribution | thermal conductivity | median | 38 W/(m K) | highest | 72 W/(m K) (palladium) | lowest | 17 W/(m K) (yttrium) | distribution | (properties at standard conditions)
Electromagnetic properties
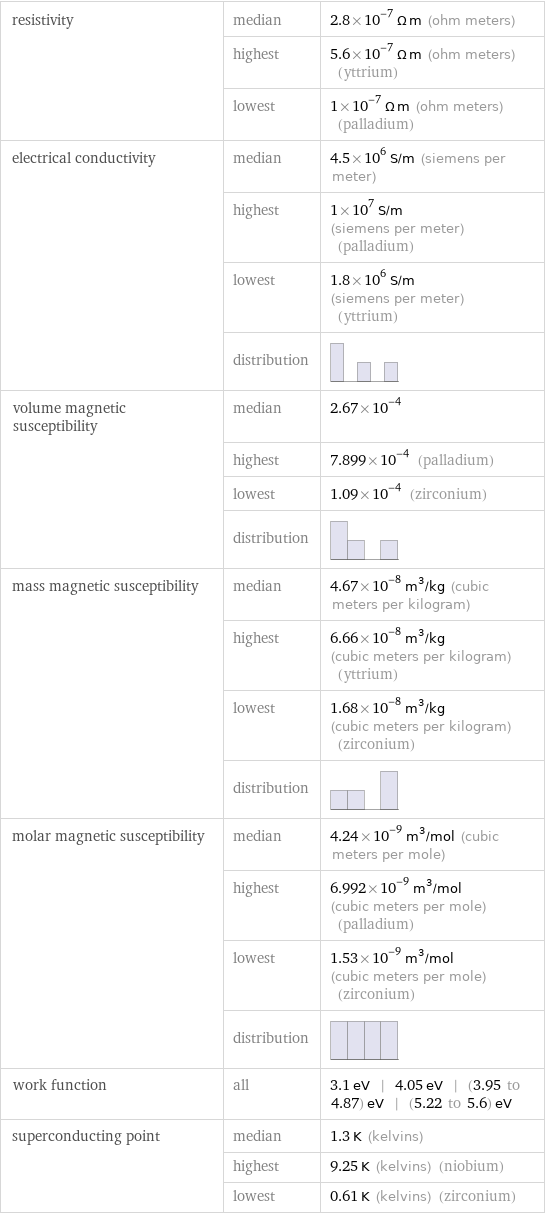
resistivity | median | 2.8×10^-7 Ω m (ohm meters) | highest | 5.6×10^-7 Ω m (ohm meters) (yttrium) | lowest | 1×10^-7 Ω m (ohm meters) (palladium) electrical conductivity | median | 4.5×10^6 S/m (siemens per meter) | highest | 1×10^7 S/m (siemens per meter) (palladium) | lowest | 1.8×10^6 S/m (siemens per meter) (yttrium) | distribution | volume magnetic susceptibility | median | 2.67×10^-4 | highest | 7.899×10^-4 (palladium) | lowest | 1.09×10^-4 (zirconium) | distribution | mass magnetic susceptibility | median | 4.67×10^-8 m^3/kg (cubic meters per kilogram) | highest | 6.66×10^-8 m^3/kg (cubic meters per kilogram) (yttrium) | lowest | 1.68×10^-8 m^3/kg (cubic meters per kilogram) (zirconium) | distribution | molar magnetic susceptibility | median | 4.24×10^-9 m^3/mol (cubic meters per mole) | highest | 6.992×10^-9 m^3/mol (cubic meters per mole) (palladium) | lowest | 1.53×10^-9 m^3/mol (cubic meters per mole) (zirconium) | distribution | work function | all | 3.1 eV | 4.05 eV | (3.95 to 4.87) eV | (5.22 to 5.6) eV superconducting point | median | 1.3 K (kelvins) | highest | 9.25 K (kelvins) (niobium) | lowest | 0.61 K (kelvins) (zirconium)
Reactivity
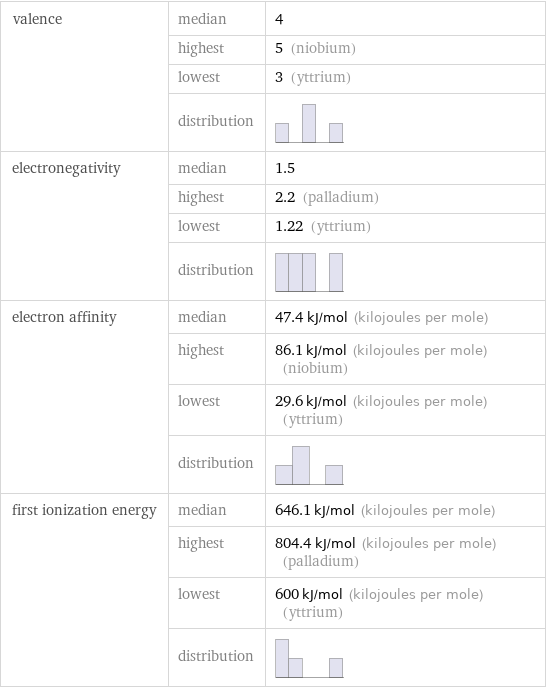
valence | median | 4 | highest | 5 (niobium) | lowest | 3 (yttrium) | distribution | electronegativity | median | 1.5 | highest | 2.2 (palladium) | lowest | 1.22 (yttrium) | distribution | electron affinity | median | 47.4 kJ/mol (kilojoules per mole) | highest | 86.1 kJ/mol (kilojoules per mole) (niobium) | lowest | 29.6 kJ/mol (kilojoules per mole) (yttrium) | distribution | first ionization energy | median | 646.1 kJ/mol (kilojoules per mole) | highest | 804.4 kJ/mol (kilojoules per mole) (palladium) | lowest | 600 kJ/mol (kilojoules per mole) (yttrium) | distribution |
Atomic properties
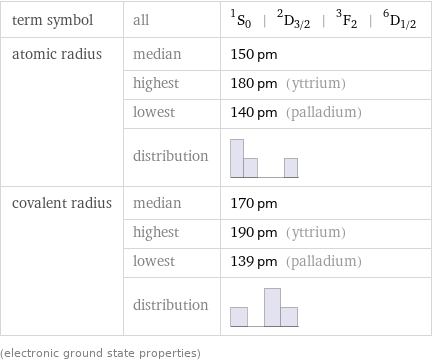
term symbol | all | ^1S_0 | ^2D_(3/2) | ^3F_2 | ^6D_(1/2) atomic radius | median | 150 pm | highest | 180 pm (yttrium) | lowest | 140 pm (palladium) | distribution | covalent radius | median | 170 pm | highest | 190 pm (yttrium) | lowest | 139 pm (palladium) | distribution | (electronic ground state properties)
Abundances
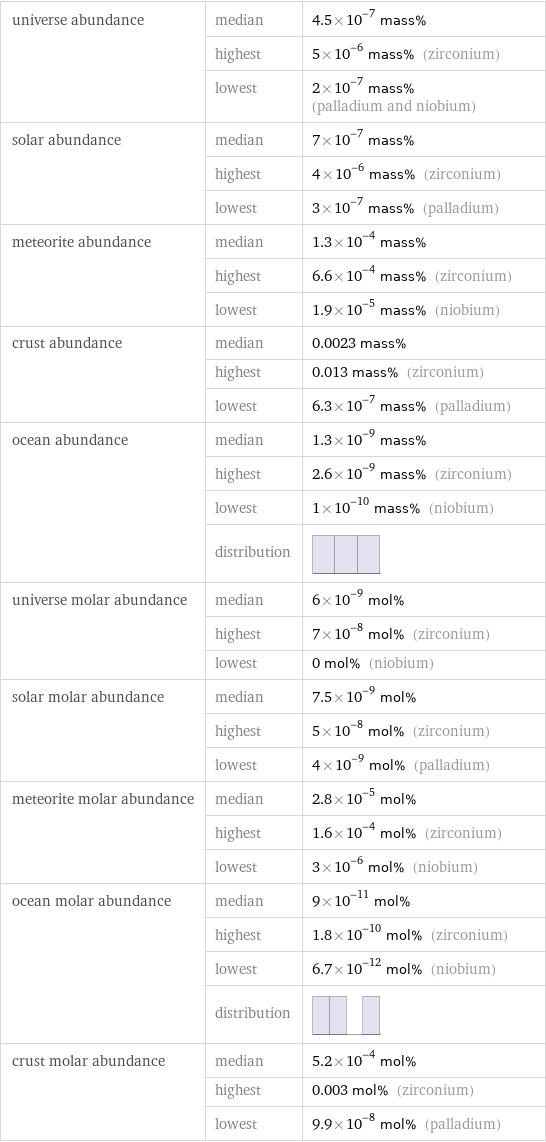
universe abundance | median | 4.5×10^-7 mass% | highest | 5×10^-6 mass% (zirconium) | lowest | 2×10^-7 mass% (palladium and niobium) solar abundance | median | 7×10^-7 mass% | highest | 4×10^-6 mass% (zirconium) | lowest | 3×10^-7 mass% (palladium) meteorite abundance | median | 1.3×10^-4 mass% | highest | 6.6×10^-4 mass% (zirconium) | lowest | 1.9×10^-5 mass% (niobium) crust abundance | median | 0.0023 mass% | highest | 0.013 mass% (zirconium) | lowest | 6.3×10^-7 mass% (palladium) ocean abundance | median | 1.3×10^-9 mass% | highest | 2.6×10^-9 mass% (zirconium) | lowest | 1×10^-10 mass% (niobium) | distribution | universe molar abundance | median | 6×10^-9 mol% | highest | 7×10^-8 mol% (zirconium) | lowest | 0 mol% (niobium) solar molar abundance | median | 7.5×10^-9 mol% | highest | 5×10^-8 mol% (zirconium) | lowest | 4×10^-9 mol% (palladium) meteorite molar abundance | median | 2.8×10^-5 mol% | highest | 1.6×10^-4 mol% (zirconium) | lowest | 3×10^-6 mol% (niobium) ocean molar abundance | median | 9×10^-11 mol% | highest | 1.8×10^-10 mol% (zirconium) | lowest | 6.7×10^-12 mol% (niobium) | distribution | crust molar abundance | median | 5.2×10^-4 mol% | highest | 0.003 mol% (zirconium) | lowest | 9.9×10^-8 mol% (palladium)