Input interpretation

metalloids | thermal expansion
Summary

median | 6×10^-6 K^(-1) highest | 1.1×10^-5 K^(-1) (antimony) lowest | 2.6×10^-6 K^(-1) (silicon) distribution | | (based on 4 values; 4 unavailable)
Entities with missing values

arsenic | tellurium | polonium | tennessine (total: 4)
Ranked values

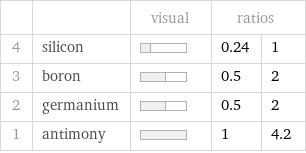
| | visual | ratios | 4 | silicon | | 0.24 | 1 3 | boron | | 0.5 | 2 2 | germanium | | 0.5 | 2 1 | antimony | | 1 | 4.2
Thermal expansion rankings

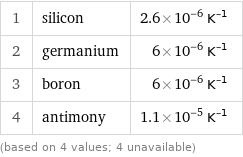
1 | silicon | 2.6×10^-6 K^(-1) 2 | germanium | 6×10^-6 K^(-1) 3 | boron | 6×10^-6 K^(-1) 4 | antimony | 1.1×10^-5 K^(-1) (based on 4 values; 4 unavailable)
Unit conversions for median thermal expansion 6×10^-6 K^(-1)

≈ 6×10^-6 °C^(-1) (reciprocal degrees Celsius difference)

≈ 3×10^-6 °F^(-1) (reciprocal degrees Fahrenheit difference)
Comparisons for median thermal expansion 6×10^-6 K^(-1)

≈ 0.4 × gold linear thermal expansion coefficient ( ≈ 1.4×10^-5 K^(-1) )

≈ 0.5 × iron linear thermal expansion coefficient ( ≈ 1.2×10^-5 K^(-1) )

≈ 0.8 × linear thermal expansion coefficient of graphite (parallel to graphite planes) ( ≈ 7×10^-6 K^(-1) )