Input interpretation

non-metallic elements | discovery country
Summary

France | Germany | India | Russia | Sweden | United Kingdom | United States (based on 17 values; 2 unavailable)
Entities with missing values

carbon | sulfur (total: 2)
Table
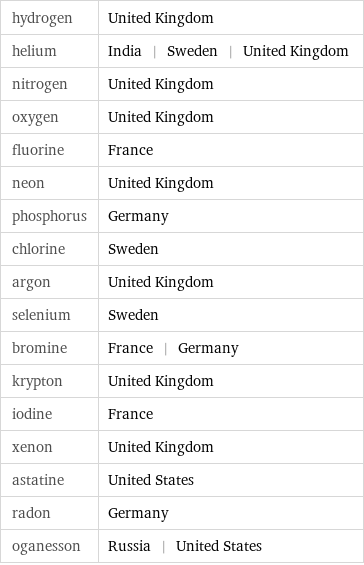
hydrogen | United Kingdom helium | India | Sweden | United Kingdom nitrogen | United Kingdom oxygen | United Kingdom fluorine | France neon | United Kingdom phosphorus | Germany chlorine | Sweden argon | United Kingdom selenium | Sweden bromine | France | Germany krypton | United Kingdom iodine | France xenon | United Kingdom astatine | United States radon | Germany oganesson | Russia | United States
Flags
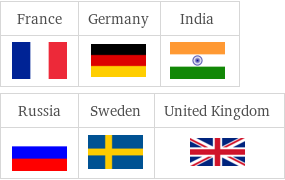
Flags
Locations
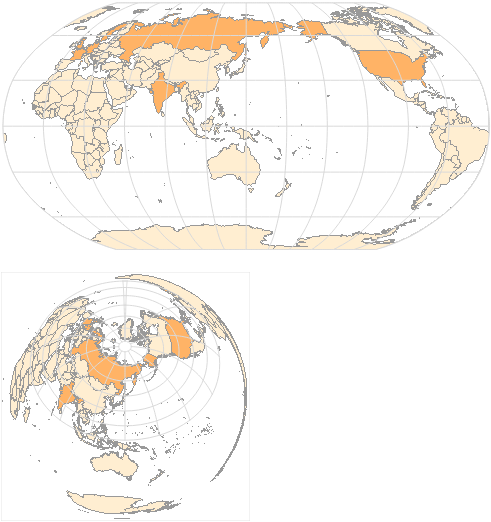
Locations
Geographic properties
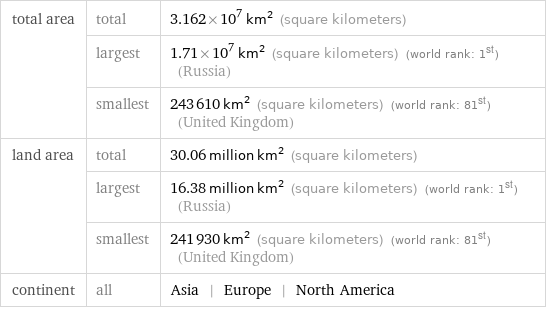
total area | total | 3.162×10^7 km^2 (square kilometers) | largest | 1.71×10^7 km^2 (square kilometers) (world rank: 1st) (Russia) | smallest | 243610 km^2 (square kilometers) (world rank: 81st) (United Kingdom) land area | total | 30.06 million km^2 (square kilometers) | largest | 16.38 million km^2 (square kilometers) (world rank: 1st) (Russia) | smallest | 241930 km^2 (square kilometers) (world rank: 81st) (United Kingdom) continent | all | Asia | Europe | North America
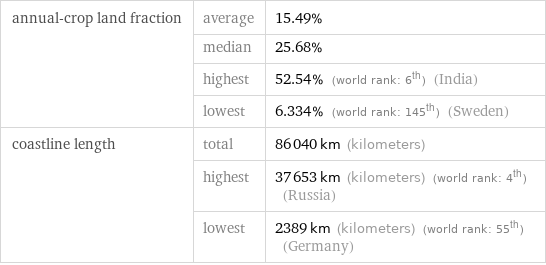
annual-crop land fraction | average | 15.49% | median | 25.68% | highest | 52.54% (world rank: 6th) (India) | lowest | 6.334% (world rank: 145th) (Sweden) coastline length | total | 86040 km (kilometers) | highest | 37653 km (kilometers) (world rank: 4th) (Russia) | lowest | 2389 km (kilometers) (world rank: 55th) (Germany)
Demographics
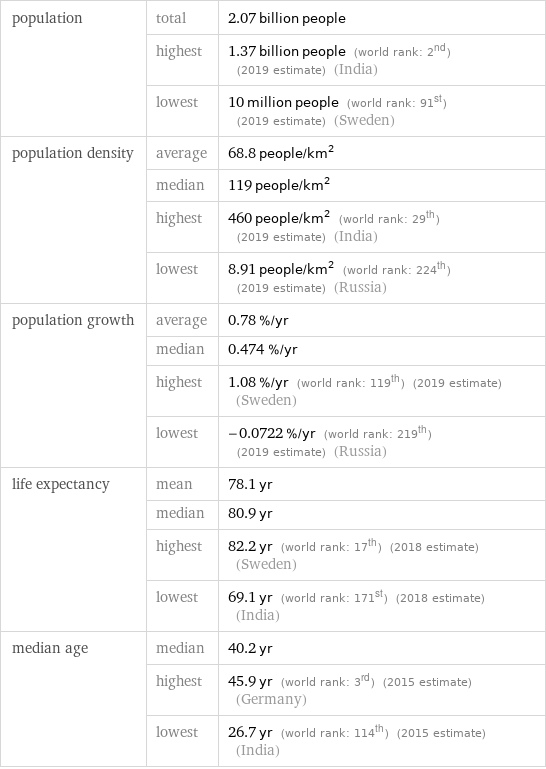
population | total | 2.07 billion people | highest | 1.37 billion people (world rank: 2nd) (2019 estimate) (India) | lowest | 10 million people (world rank: 91st) (2019 estimate) (Sweden) population density | average | 68.8 people/km^2 | median | 119 people/km^2 | highest | 460 people/km^2 (world rank: 29th) (2019 estimate) (India) | lowest | 8.91 people/km^2 (world rank: 224th) (2019 estimate) (Russia) population growth | average | 0.78 %/yr | median | 0.474 %/yr | highest | 1.08 %/yr (world rank: 119th) (2019 estimate) (Sweden) | lowest | -0.0722 %/yr (world rank: 219th) (2019 estimate) (Russia) life expectancy | mean | 78.1 yr | median | 80.9 yr | highest | 82.2 yr (world rank: 17th) (2018 estimate) (Sweden) | lowest | 69.1 yr (world rank: 171st) (2018 estimate) (India) median age | median | 40.2 yr | highest | 45.9 yr (world rank: 3rd) (2015 estimate) (Germany) | lowest | 26.7 yr (world rank: 114th) (2015 estimate) (India)
Rates
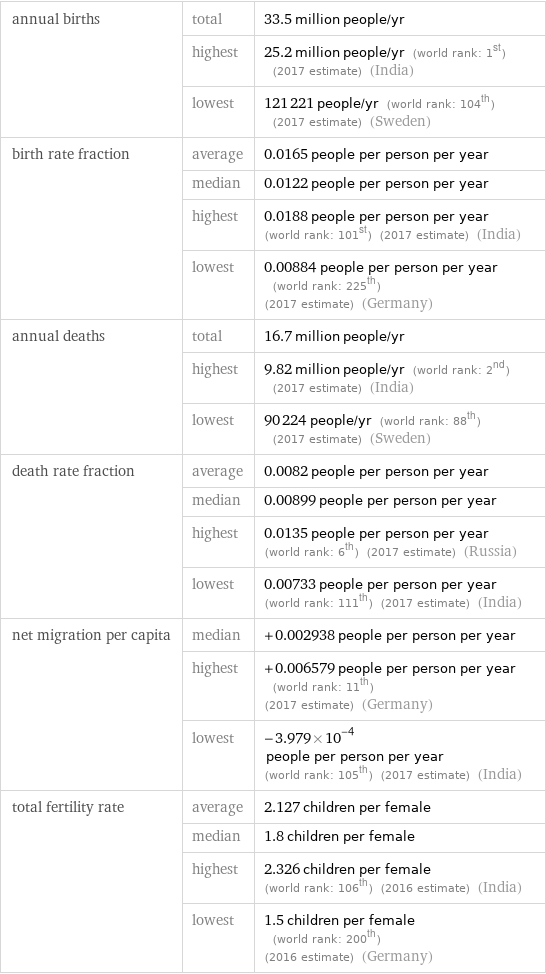
annual births | total | 33.5 million people/yr | highest | 25.2 million people/yr (world rank: 1st) (2017 estimate) (India) | lowest | 121221 people/yr (world rank: 104th) (2017 estimate) (Sweden) birth rate fraction | average | 0.0165 people per person per year | median | 0.0122 people per person per year | highest | 0.0188 people per person per year (world rank: 101st) (2017 estimate) (India) | lowest | 0.00884 people per person per year (world rank: 225th) (2017 estimate) (Germany) annual deaths | total | 16.7 million people/yr | highest | 9.82 million people/yr (world rank: 2nd) (2017 estimate) (India) | lowest | 90224 people/yr (world rank: 88th) (2017 estimate) (Sweden) death rate fraction | average | 0.0082 people per person per year | median | 0.00899 people per person per year | highest | 0.0135 people per person per year (world rank: 6th) (2017 estimate) (Russia) | lowest | 0.00733 people per person per year (world rank: 111th) (2017 estimate) (India) net migration per capita | median | +0.002938 people per person per year | highest | +0.006579 people per person per year (world rank: 11th) (2017 estimate) (Germany) | lowest | -3.979×10^-4 people per person per year (world rank: 105th) (2017 estimate) (India) total fertility rate | average | 2.127 children per female | median | 1.8 children per female | highest | 2.326 children per female (world rank: 106th) (2016 estimate) (India) | lowest | 1.5 children per female (world rank: 200th) (2016 estimate) (Germany)
Economic properties
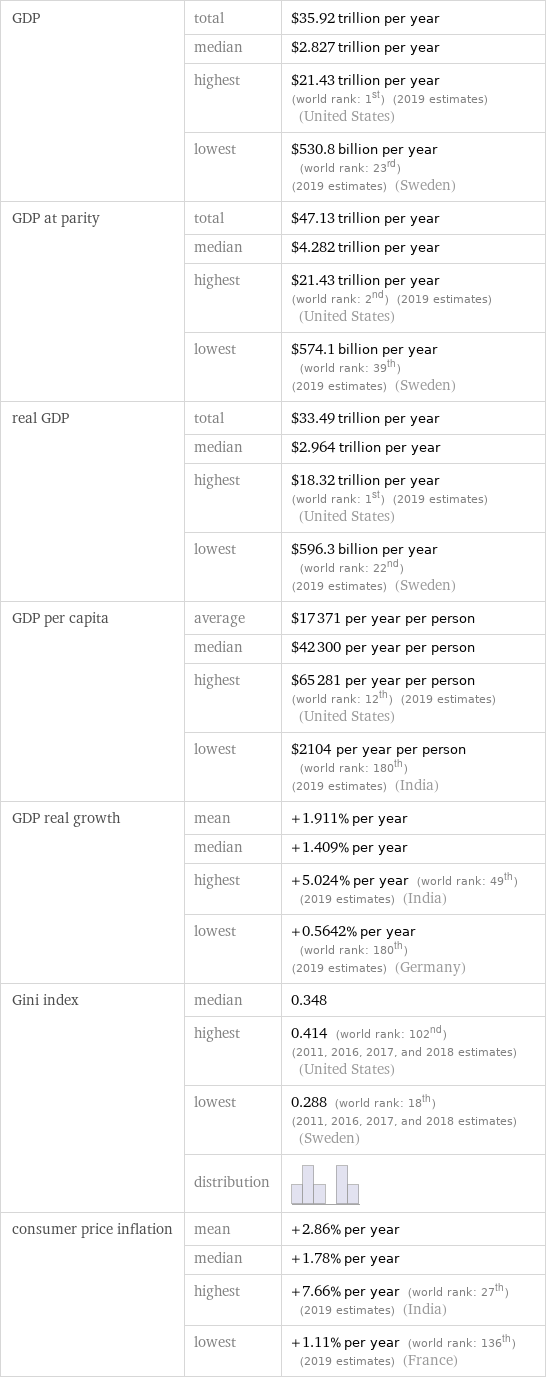
GDP | total | $35.92 trillion per year | median | $2.827 trillion per year | highest | $21.43 trillion per year (world rank: 1st) (2019 estimates) (United States) | lowest | $530.8 billion per year (world rank: 23rd) (2019 estimates) (Sweden) GDP at parity | total | $47.13 trillion per year | median | $4.282 trillion per year | highest | $21.43 trillion per year (world rank: 2nd) (2019 estimates) (United States) | lowest | $574.1 billion per year (world rank: 39th) (2019 estimates) (Sweden) real GDP | total | $33.49 trillion per year | median | $2.964 trillion per year | highest | $18.32 trillion per year (world rank: 1st) (2019 estimates) (United States) | lowest | $596.3 billion per year (world rank: 22nd) (2019 estimates) (Sweden) GDP per capita | average | $17371 per year per person | median | $42300 per year per person | highest | $65281 per year per person (world rank: 12th) (2019 estimates) (United States) | lowest | $2104 per year per person (world rank: 180th) (2019 estimates) (India) GDP real growth | mean | +1.911% per year | median | +1.409% per year | highest | +5.024% per year (world rank: 49th) (2019 estimates) (India) | lowest | +0.5642% per year (world rank: 180th) (2019 estimates) (Germany) Gini index | median | 0.348 | highest | 0.414 (world rank: 102nd) (2011, 2016, 2017, and 2018 estimates) (United States) | lowest | 0.288 (world rank: 18th) (2011, 2016, 2017, and 2018 estimates) (Sweden) | distribution | consumer price inflation | mean | +2.86% per year | median | +1.78% per year | highest | +7.66% per year (world rank: 27th) (2019 estimates) (India) | lowest | +1.11% per year (world rank: 136th) (2019 estimates) (France)