Input interpretation

standard growth curve
Input value

age | 12 months
Length information
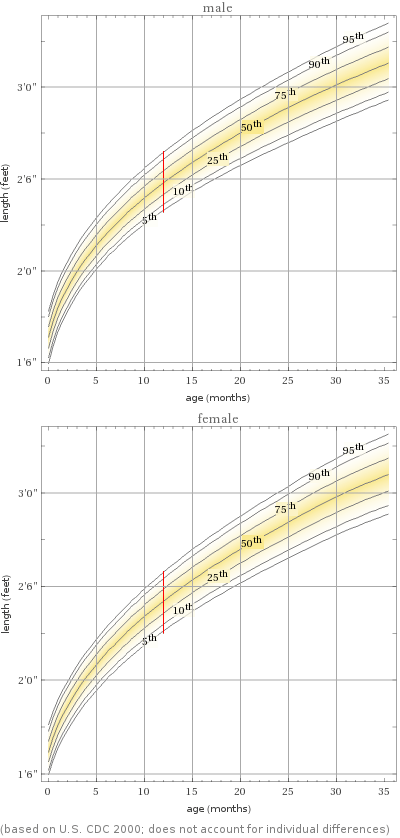
(based on U.S. CDC 2000; does not account for individual differences)
Length distribution for infants age 12 months
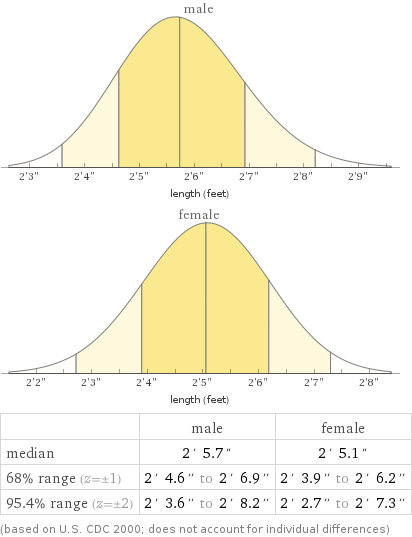
| male | female median | 2' 5.7" | 2' 5.1" 68% range (z = ±1) | 2' 4.6" to 2' 6.9" | 2' 3.9" to 2' 6.2" 95.4% range (z = ±2) | 2' 3.6" to 2' 8.2" | 2' 2.7" to 2' 7.3" (based on U.S. CDC 2000; does not account for individual differences)
Weight information
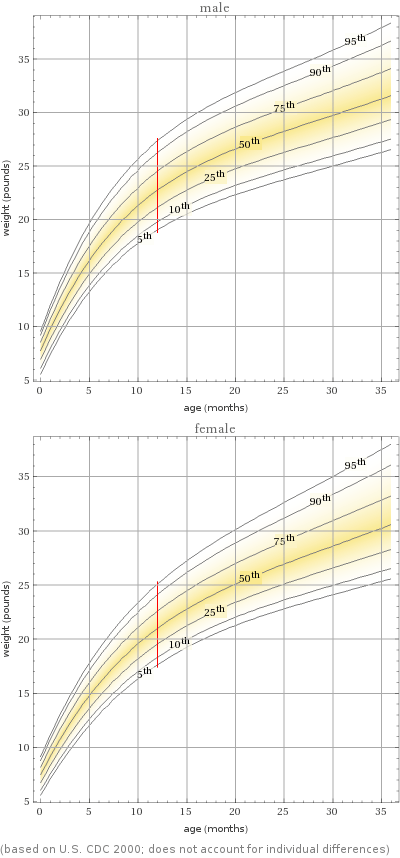
(based on U.S. CDC 2000; does not account for individual differences)
Weight distribution for infants age 12 months
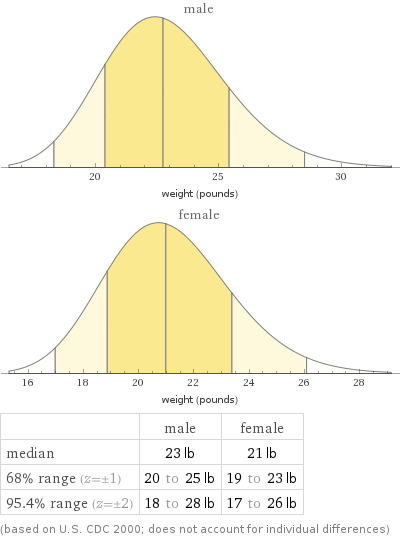
| male | female median | 23 lb | 21 lb 68% range (z = ±1) | 20 to 25 lb | 19 to 23 lb 95.4% range (z = ±2) | 18 to 28 lb | 17 to 26 lb (based on U.S. CDC 2000; does not account for individual differences)
Weight vs length information
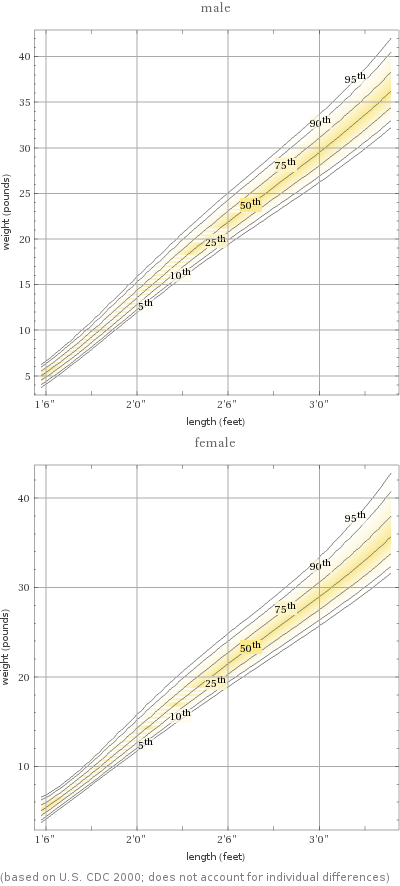
(based on U.S. CDC 2000; does not account for individual differences)