Input interpretation

lanthanides | discovery country
Summary

Austria | France | Germany | Sweden | Switzerland | United States
Table
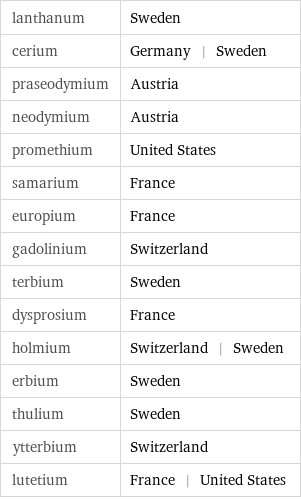
lanthanum | Sweden cerium | Germany | Sweden praseodymium | Austria neodymium | Austria promethium | United States samarium | France europium | France gadolinium | Switzerland terbium | Sweden dysprosium | France holmium | Switzerland | Sweden erbium | Sweden thulium | Sweden ytterbium | Switzerland lutetium | France | United States
Flags
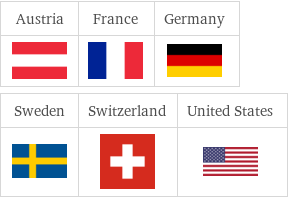
Flags
Locations
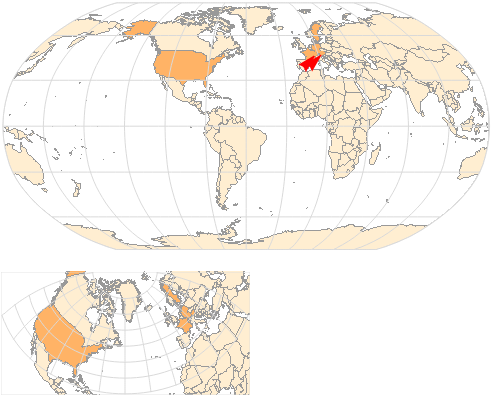
Locations
Geographic properties
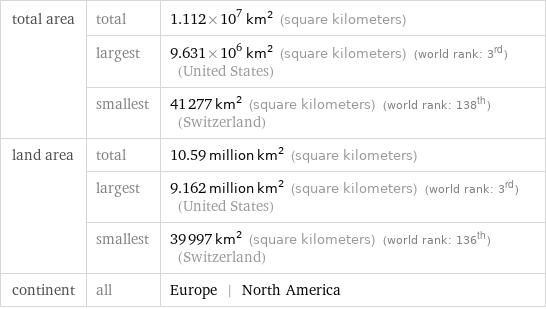
total area | total | 1.112×10^7 km^2 (square kilometers) | largest | 9.631×10^6 km^2 (square kilometers) (world rank: 3rd) (United States) | smallest | 41277 km^2 (square kilometers) (world rank: 138th) (Switzerland) land area | total | 10.59 million km^2 (square kilometers) | largest | 9.162 million km^2 (square kilometers) (world rank: 3rd) (United States) | smallest | 39997 km^2 (square kilometers) (world rank: 136th) (Switzerland) continent | all | Europe | North America
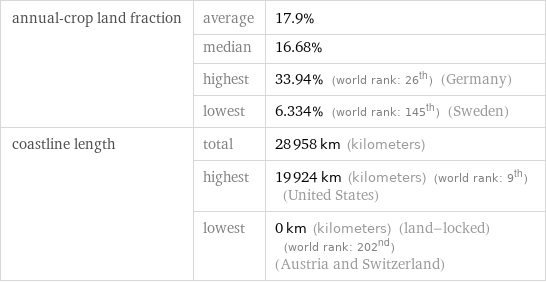
annual-crop land fraction | average | 17.9% | median | 16.68% | highest | 33.94% (world rank: 26th) (Germany) | lowest | 6.334% (world rank: 145th) (Sweden) coastline length | total | 28958 km (kilometers) | highest | 19924 km (kilometers) (world rank: 9th) (United States) | lowest | 0 km (kilometers) (land-locked) (world rank: 202nd) (Austria and Switzerland)
Demographics
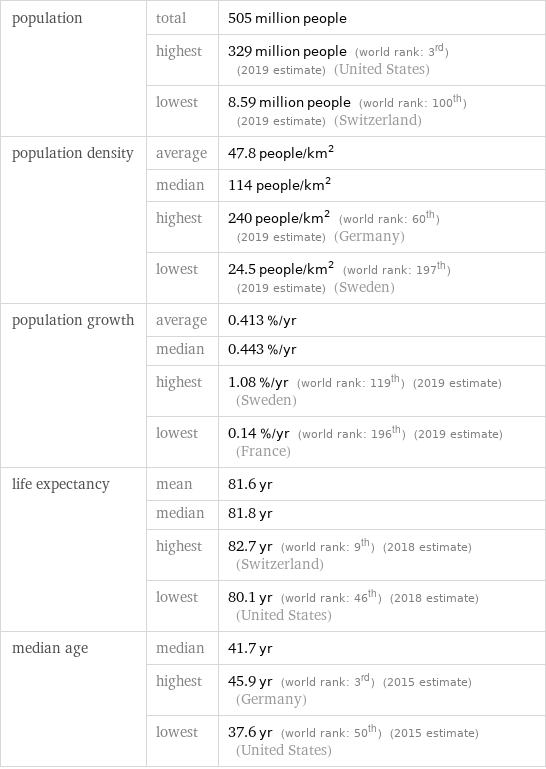
population | total | 505 million people | highest | 329 million people (world rank: 3rd) (2019 estimate) (United States) | lowest | 8.59 million people (world rank: 100th) (2019 estimate) (Switzerland) population density | average | 47.8 people/km^2 | median | 114 people/km^2 | highest | 240 people/km^2 (world rank: 60th) (2019 estimate) (Germany) | lowest | 24.5 people/km^2 (world rank: 197th) (2019 estimate) (Sweden) population growth | average | 0.413 %/yr | median | 0.443 %/yr | highest | 1.08 %/yr (world rank: 119th) (2019 estimate) (Sweden) | lowest | 0.14 %/yr (world rank: 196th) (2019 estimate) (France) life expectancy | mean | 81.6 yr | median | 81.8 yr | highest | 82.7 yr (world rank: 9th) (2018 estimate) (Switzerland) | lowest | 80.1 yr (world rank: 46th) (2018 estimate) (United States) median age | median | 41.7 yr | highest | 45.9 yr (world rank: 3rd) (2015 estimate) (Germany) | lowest | 37.6 yr (world rank: 50th) (2015 estimate) (United States)
Rates
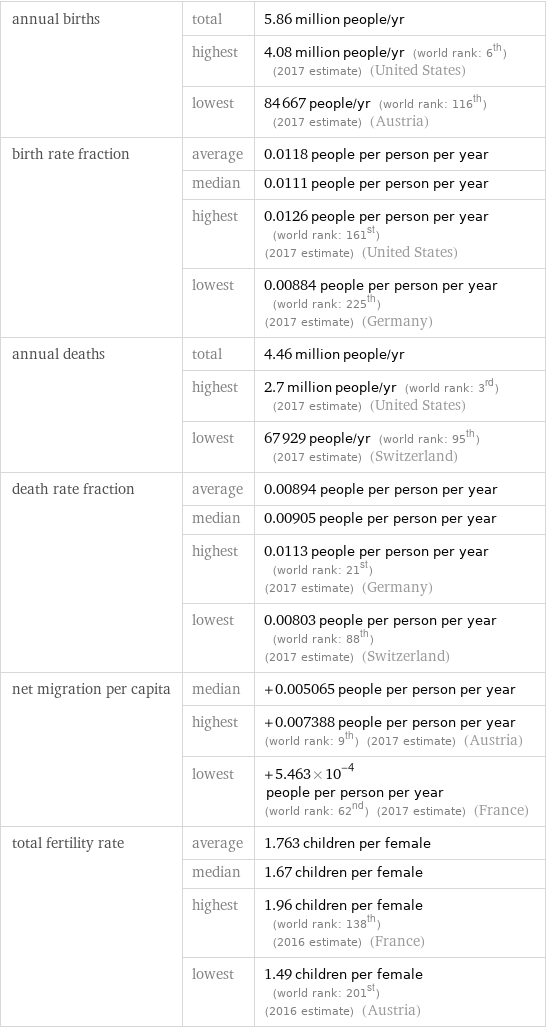
annual births | total | 5.86 million people/yr | highest | 4.08 million people/yr (world rank: 6th) (2017 estimate) (United States) | lowest | 84667 people/yr (world rank: 116th) (2017 estimate) (Austria) birth rate fraction | average | 0.0118 people per person per year | median | 0.0111 people per person per year | highest | 0.0126 people per person per year (world rank: 161st) (2017 estimate) (United States) | lowest | 0.00884 people per person per year (world rank: 225th) (2017 estimate) (Germany) annual deaths | total | 4.46 million people/yr | highest | 2.7 million people/yr (world rank: 3rd) (2017 estimate) (United States) | lowest | 67929 people/yr (world rank: 95th) (2017 estimate) (Switzerland) death rate fraction | average | 0.00894 people per person per year | median | 0.00905 people per person per year | highest | 0.0113 people per person per year (world rank: 21st) (2017 estimate) (Germany) | lowest | 0.00803 people per person per year (world rank: 88th) (2017 estimate) (Switzerland) net migration per capita | median | +0.005065 people per person per year | highest | +0.007388 people per person per year (world rank: 9th) (2017 estimate) (Austria) | lowest | +5.463×10^-4 people per person per year (world rank: 62nd) (2017 estimate) (France) total fertility rate | average | 1.763 children per female | median | 1.67 children per female | highest | 1.96 children per female (world rank: 138th) (2016 estimate) (France) | lowest | 1.49 children per female (world rank: 201st) (2016 estimate) (Austria)
Economic properties
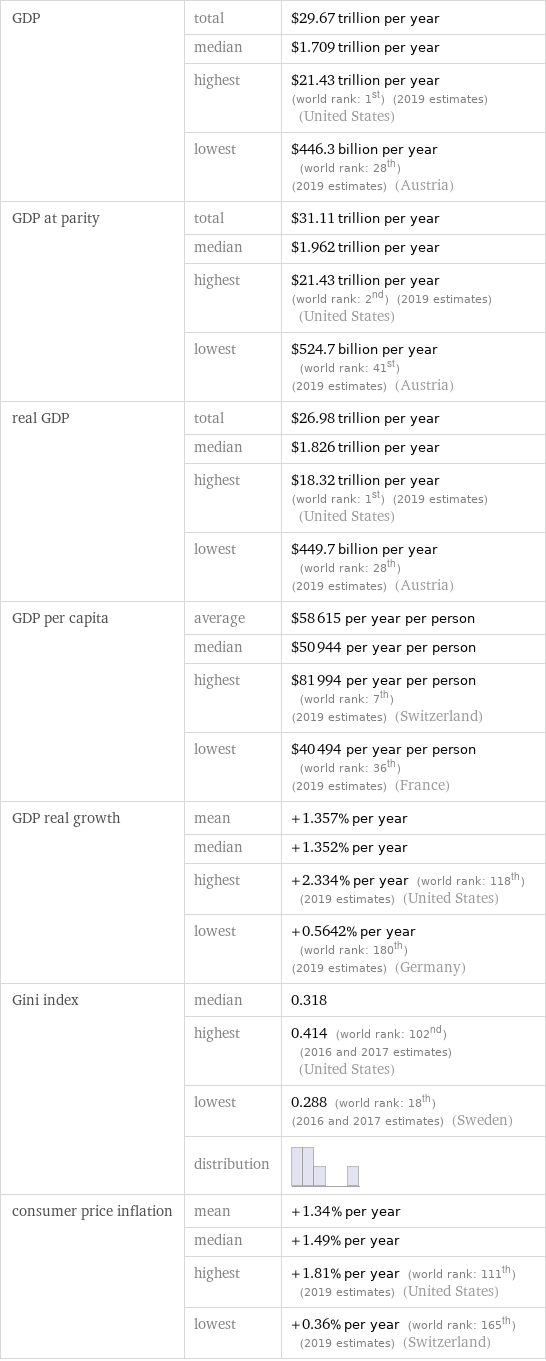
GDP | total | $29.67 trillion per year | median | $1.709 trillion per year | highest | $21.43 trillion per year (world rank: 1st) (2019 estimates) (United States) | lowest | $446.3 billion per year (world rank: 28th) (2019 estimates) (Austria) GDP at parity | total | $31.11 trillion per year | median | $1.962 trillion per year | highest | $21.43 trillion per year (world rank: 2nd) (2019 estimates) (United States) | lowest | $524.7 billion per year (world rank: 41st) (2019 estimates) (Austria) real GDP | total | $26.98 trillion per year | median | $1.826 trillion per year | highest | $18.32 trillion per year (world rank: 1st) (2019 estimates) (United States) | lowest | $449.7 billion per year (world rank: 28th) (2019 estimates) (Austria) GDP per capita | average | $58615 per year per person | median | $50944 per year per person | highest | $81994 per year per person (world rank: 7th) (2019 estimates) (Switzerland) | lowest | $40494 per year per person (world rank: 36th) (2019 estimates) (France) GDP real growth | mean | +1.357% per year | median | +1.352% per year | highest | +2.334% per year (world rank: 118th) (2019 estimates) (United States) | lowest | +0.5642% per year (world rank: 180th) (2019 estimates) (Germany) Gini index | median | 0.318 | highest | 0.414 (world rank: 102nd) (2016 and 2017 estimates) (United States) | lowest | 0.288 (world rank: 18th) (2016 and 2017 estimates) (Sweden) | distribution | consumer price inflation | mean | +1.34% per year | median | +1.49% per year | highest | +1.81% per year (world rank: 111th) (2019 estimates) (United States) | lowest | +0.36% per year (world rank: 165th) (2019 estimates) (Switzerland)