Input interpretation

nitrogen | discovery country
Result

United Kingdom
Name
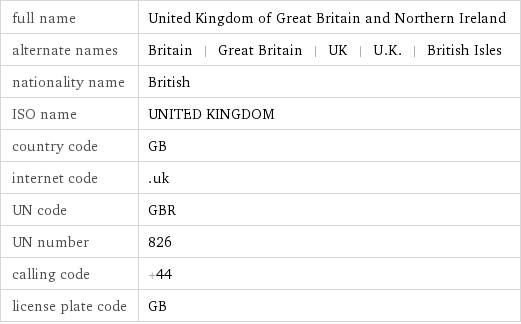
full name | United Kingdom of Great Britain and Northern Ireland alternate names | Britain | Great Britain | UK | U.K. | British Isles nationality name | British ISO name | UNITED KINGDOM country code | GB internet code | .uk UN code | GBR UN number | 826 calling code | +44 license plate code | GB
Flag

Flag
Location
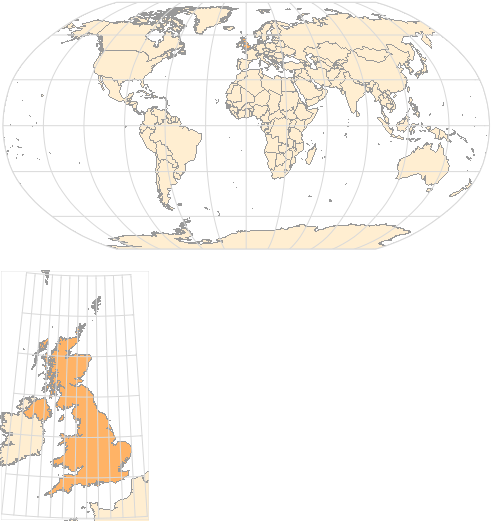
Location
Geographic properties

total area | 243610 km^2 (square kilometers) (world rank: 81st) land area | 241930 km^2 (square kilometers) (world rank: 81st) continent | Europe
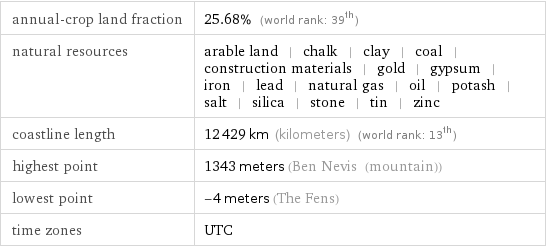
annual-crop land fraction | 25.68% (world rank: 39th) natural resources | arable land | chalk | clay | coal | construction materials | gold | gypsum | iron | lead | natural gas | oil | potash | salt | silica | stone | tin | zinc coastline length | 12429 km (kilometers) (world rank: 13th) highest point | 1343 meters (Ben Nevis (mountain)) lowest point | -4 meters (The Fens) time zones | UTC
Bordering country/region

Ireland 360 km (kilometers)
Dependencies

Anguilla | Bermuda | British Indian Ocean Territory | British Virgin Islands | Cayman Islands | Falkland Islands | Gibraltar | Guernsey | Isle of Man | Jersey | Montserrat | Pitcairn Islands | Saint Helena, Ascension and Tristan da Cunha | South Georgia and the South Sandwich Islands | Turks and Caicos Islands
Demographics

population | 66.2 million people (world rank: 21st) (2017 estimate) population density | 274 people/km^2 (people per square kilometer) (world rank: 53rd) (2017 estimate) population growth | 0.648 %/yr (world rank: 159th) (2017 estimate) life expectancy | 80.9 years (world rank: 39th) (2018 estimate) median age | 40.2 years (world rank: 35th) (2015 estimate)
Rates
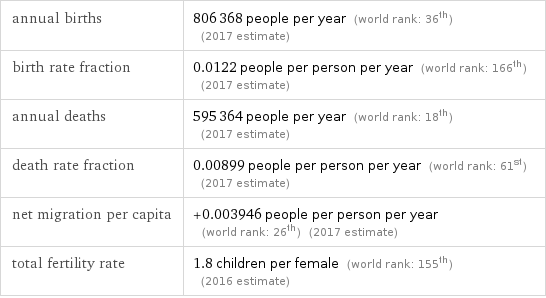
annual births | 806368 people per year (world rank: 36th) (2017 estimate) birth rate fraction | 0.0122 people per person per year (world rank: 166th) (2017 estimate) annual deaths | 595364 people per year (world rank: 18th) (2017 estimate) death rate fraction | 0.00899 people per person per year (world rank: 61st) (2017 estimate) net migration per capita | +0.003946 people per person per year (world rank: 26th) (2017 estimate) total fertility rate | 1.8 children per female (world rank: 155th) (2016 estimate)
Distribution
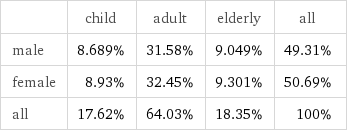
| child | adult | elderly | all male | 8.689% | 31.58% | 9.049% | 49.31% female | 8.93% | 32.45% | 9.301% | 50.69% all | 17.62% | 64.03% | 18.35% | 100%
Cultural properties
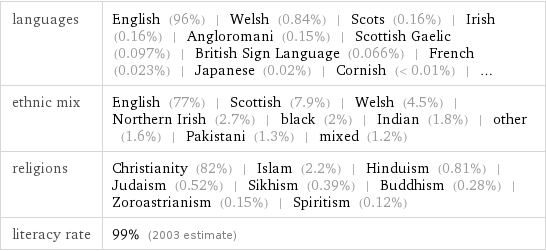
languages | English (96%) | Welsh (0.84%) | Scots (0.16%) | Irish (0.16%) | Angloromani (0.15%) | Scottish Gaelic (0.097%) | British Sign Language (0.066%) | French (0.023%) | Japanese (0.02%) | Cornish (< 0.01%) | ... ethnic mix | English (77%) | Scottish (7.9%) | Welsh (4.5%) | Northern Irish (2.7%) | black (2%) | Indian (1.8%) | other (1.6%) | Pakistani (1.3%) | mixed (1.2%) religions | Christianity (82%) | Islam (2.2%) | Hinduism (0.81%) | Judaism (0.52%) | Sikhism (0.39%) | Buddhism (0.28%) | Zoroastrianism (0.15%) | Spiritism (0.12%) literacy rate | 99% (2003 estimate)
Ethnic mix
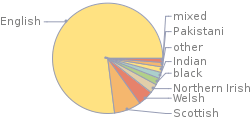
Cultural properties Ethnic mix
Religions
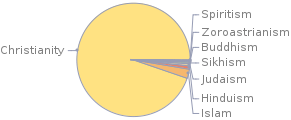
Cultural properties Religions
Capital city

London, Greater London
Largest cities
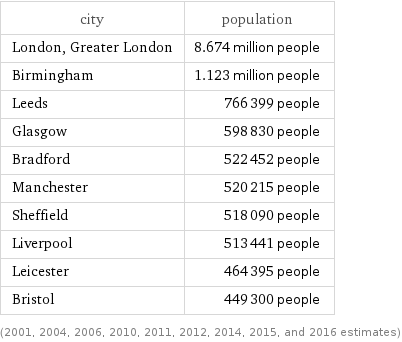
city | population London, Greater London | 8.674 million people Birmingham | 1.123 million people Leeds | 766399 people Glasgow | 598830 people Bradford | 522452 people Manchester | 520215 people Sheffield | 518090 people Liverpool | 513441 people Leicester | 464395 people Bristol | 449300 people (2001, 2004, 2006, 2010, 2011, 2012, 2014, 2015, and 2016 estimates)
Currency

currency unit | £1 (British pound) currency code | GBP local currency conversion | £1 (British pound) = €1.11 (euros) currency conversion | £1 (British pound) = $1.31 (US dollars)
Economic properties
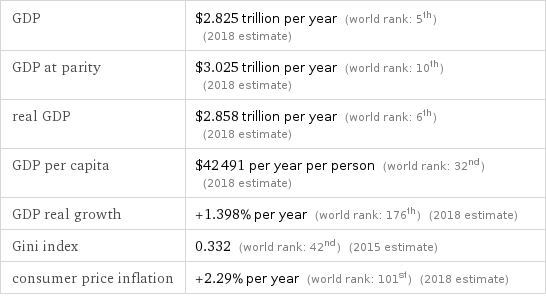
GDP | $2.825 trillion per year (world rank: 5th) (2018 estimate) GDP at parity | $3.025 trillion per year (world rank: 10th) (2018 estimate) real GDP | $2.858 trillion per year (world rank: 6th) (2018 estimate) GDP per capita | $42491 per year per person (world rank: 32nd) (2018 estimate) GDP real growth | +1.398% per year (world rank: 176th) (2018 estimate) Gini index | 0.332 (world rank: 42nd) (2015 estimate) consumer price inflation | +2.29% per year (world rank: 101st) (2018 estimate)
Employment

unemployment rate | 3.81% (world rank: 148th highest) (2019 estimate) long-term unemployment rate | 2.18% (world rank: 61st highest) (2014 estimate) labor force | 34.28 million people (51.62% of population) (world rank: 17th) (2019 estimate)
Labor force information

primary education | 5.535 million people (world rank: 24th) (2014 estimate) secondary education | 13.89 million people (world rank: 10th) (2014 estimate) tertiary education | 13.26 million people (world rank: 7th) (2014 estimate)
Employment information

agriculture | 374264 people (world rank: 104th) (2019 estimate) industry | 5.93 million people (world rank: 22nd) (2019 estimate) services | 26.7 million people (world rank: 11th) (2019 estimate)
Business information
Business taxes

total business tax rate | 30.6% of profit (world rank: 129th) (2019 estimate) number of business taxes | 9 (world rank: 137th) (2019 estimate)
Business statistics

new businesses registered | 663616 per year (17.66% of total businesses) (world rank: 2nd) (2016 estimate) total registered businesses | 2.546 million (world rank: 6th) (2007 estimate)
Business operating costs

typical cost of business start up procedures | 0% of GNI per capita (world rank: 1st lowest) (2019 estimate)
Business procedures
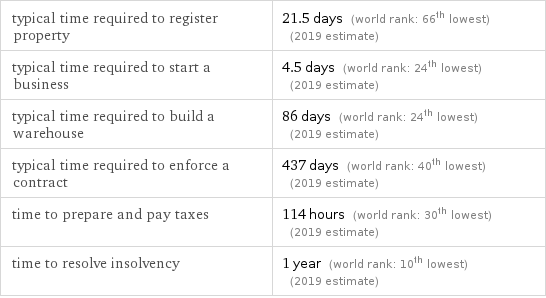
typical time required to register property | 21.5 days (world rank: 66th lowest) (2019 estimate) typical time required to start a business | 4.5 days (world rank: 24th lowest) (2019 estimate) typical time required to build a warehouse | 86 days (world rank: 24th lowest) (2019 estimate) typical time required to enforce a contract | 437 days (world rank: 40th lowest) (2019 estimate) time to prepare and pay taxes | 114 hours (world rank: 30th lowest) (2019 estimate) time to resolve insolvency | 1 year (world rank: 10th lowest) (2019 estimate)
Trade facilitation
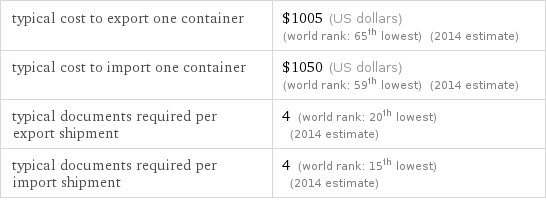
typical cost to export one container | $1005 (US dollars) (world rank: 65th lowest) (2014 estimate) typical cost to import one container | $1050 (US dollars) (world rank: 59th lowest) (2014 estimate) typical documents required per export shipment | 4 (world rank: 20th lowest) (2014 estimate) typical documents required per import shipment | 4 (world rank: 15th lowest) (2014 estimate)