Input interpretation

group 13 elements | molar magnetic susceptibility
Summary
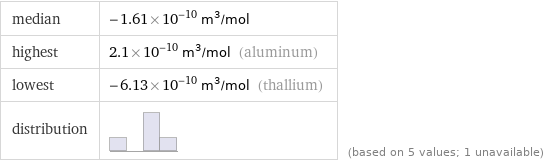
median | -1.61×10^-10 m^3/mol highest | 2.1×10^-10 m^3/mol (aluminum) lowest | -6.13×10^-10 m^3/mol (thallium) distribution | | (based on 5 values; 1 unavailable)
Entity with missing value

nihonium
Molar magnetic susceptibility rankings
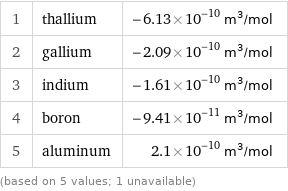
1 | thallium | -6.13×10^-10 m^3/mol 2 | gallium | -2.09×10^-10 m^3/mol 3 | indium | -1.61×10^-10 m^3/mol 4 | boron | -9.41×10^-11 m^3/mol 5 | aluminum | 2.1×10^-10 m^3/mol (based on 5 values; 1 unavailable)
Unit conversions for median molar magnetic susceptibility -1.61×10^-10 m^3/mol

-0.161 mm^3/mol (cubic millimeters per mole)

-1.61×10^-4 cm^3/mol (cubic centimeters per mole)