Input interpretation

scatter plot | metallic elements | melting point boiling point
Scatter plot

Scatter plot
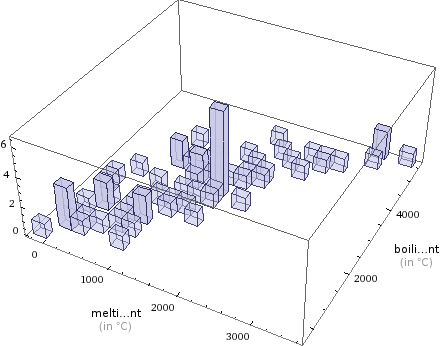
Bivariate histogram

Bivariate histogram
Statistical statements

melting point and boiling point have significantly different medians (Mann-Whitney test)
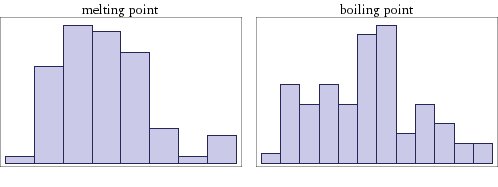
Histogram of values

Histogram of values
Statistics
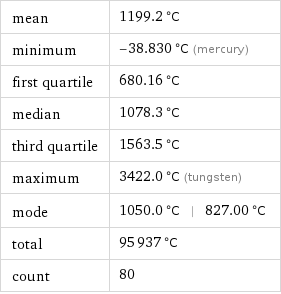
Location

mean | 1199.2 °C minimum | -38.830 °C (mercury) first quartile | 680.16 °C median | 1078.3 °C third quartile | 1563.5 °C maximum | 3422.0 °C (tungsten) mode | 1050.0 °C | 827.00 °C total | 95937 °C count | 80
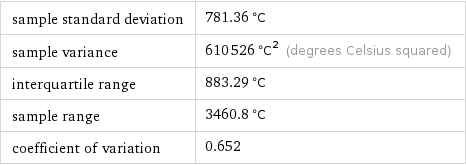
Dispersion

sample standard deviation | 781.36 °C sample variance | 610526 °C^2 (degrees Celsius squared) interquartile range | 883.29 °C sample range | 3460.8 °C coefficient of variation | 0.652
Shape

skewness | 0.681 kurtosis | 3.28