Input interpretation

group 14 elements | crust molar abundance
Summary
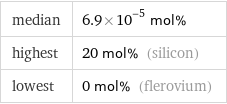
median | 6.9×10^-5 mol% highest | 20 mol% (silicon) lowest | 0 mol% (flerovium)
Units

Crust molar abundance rankings
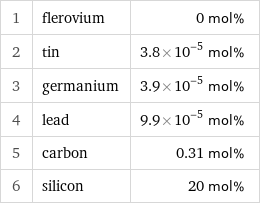
1 | flerovium | 0 mol% 2 | tin | 3.8×10^-5 mol% 3 | germanium | 3.9×10^-5 mol% 4 | lead | 9.9×10^-5 mol% 5 | carbon | 0.31 mol% 6 | silicon | 20 mol%
Corresponding quantity
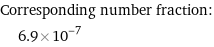
Corresponding number fraction: | 6.9×10^-7