Input interpretation

tin (chemical element) | lead (chemical element) | praseodymium (chemical element) | barium (chemical element)
Periodic table location
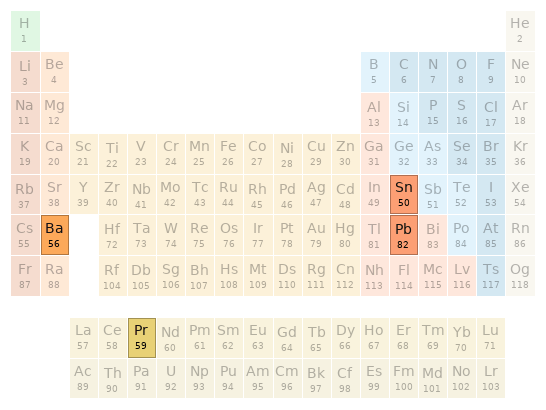
Periodic table location
Images
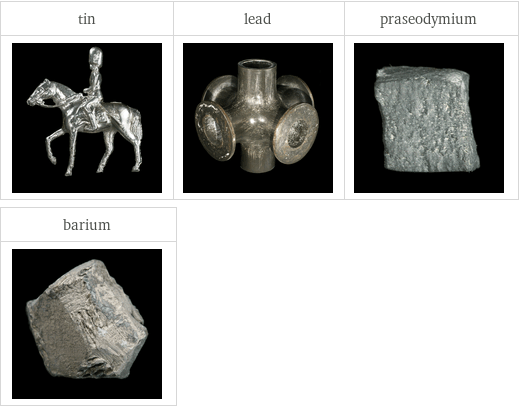
Images
Basic elemental properties
![| atomic symbol | atomic number | short electronic configuration tin | Sn | 50 | [Kr]5s^24d^105p^2 lead | Pb | 82 | [Xe]6s^24f^145d^106p^2 praseodymium | Pr | 59 | [Xe]6s^24f^3 barium | Ba | 56 | [Xe]6s^2 | Aufbau diagram | block | group tin | 5p 4d 5s | p | 14 lead | 6p 5d 4f 6s | p | 14 praseodymium | 4f 6s | f | barium | 6s | s | 2 | period | atomic mass | half-life tin | 5 | 118.71 u | (stable) lead | 6 | 207.2 u | (stable) praseodymium | 6 | 140.90766 u | (stable) barium | 6 | 137.327 u | (stable)](../image_source/47a86b8a00f6d2f99d8be3a5d4d1eaa9.png)
| atomic symbol | atomic number | short electronic configuration tin | Sn | 50 | [Kr]5s^24d^105p^2 lead | Pb | 82 | [Xe]6s^24f^145d^106p^2 praseodymium | Pr | 59 | [Xe]6s^24f^3 barium | Ba | 56 | [Xe]6s^2 | Aufbau diagram | block | group tin | 5p 4d 5s | p | 14 lead | 6p 5d 4f 6s | p | 14 praseodymium | 4f 6s | f | barium | 6s | s | 2 | period | atomic mass | half-life tin | 5 | 118.71 u | (stable) lead | 6 | 207.2 u | (stable) praseodymium | 6 | 140.90766 u | (stable) barium | 6 | 137.327 u | (stable)
Thermodynamic properties
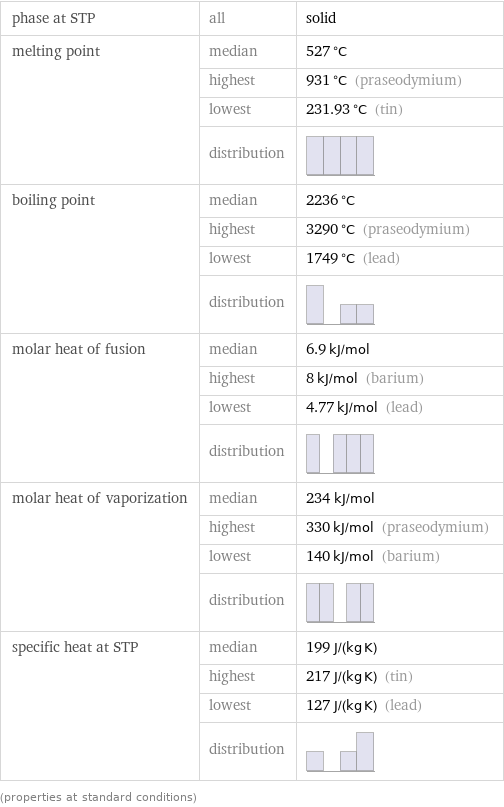
phase at STP | all | solid melting point | median | 527 °C | highest | 931 °C (praseodymium) | lowest | 231.93 °C (tin) | distribution | boiling point | median | 2236 °C | highest | 3290 °C (praseodymium) | lowest | 1749 °C (lead) | distribution | molar heat of fusion | median | 6.9 kJ/mol | highest | 8 kJ/mol (barium) | lowest | 4.77 kJ/mol (lead) | distribution | molar heat of vaporization | median | 234 kJ/mol | highest | 330 kJ/mol (praseodymium) | lowest | 140 kJ/mol (barium) | distribution | specific heat at STP | median | 199 J/(kg K) | highest | 217 J/(kg K) (tin) | lowest | 127 J/(kg K) (lead) | distribution | (properties at standard conditions)
Material properties

density | median | 6.975 g/cm^3 | highest | 11.34 g/cm^3 (lead) | lowest | 3.51 g/cm^3 (barium) | distribution | liquid density | median | 6.745 g/cm^3 | highest | 10.66 g/cm^3 (lead) | lowest | 3.338 g/cm^3 (barium) | distribution | molar volume | median | 19.75 cm^3/mol | highest | 39.12 cm^3/mol (barium) | lowest | 16.24 cm^3/mol (tin) | distribution | Mohs hardness | median | 1.5 | highest | 1.5 (between talc and gypsum) (tin and lead) | lowest | 1.25 (between talc and gypsum) (barium) | distribution | Vickers hardness | all | 400 MPa Brinell hardness | all | 38.3 MPa | 51 MPa | 481 MPa bulk modulus | median | 38 GPa | highest | 58 GPa (tin) | lowest | 9.6 GPa (barium) | distribution | shear modulus | median | 10 GPa | highest | 18 GPa (tin) | lowest | 4.9 GPa (barium) | distribution | Young's modulus | median | 26 GPa | highest | 50 GPa (tin) | lowest | 13 GPa (barium) | distribution | Poisson ratio | all | 0.28 | 0.36 | 0.44 ultimate tensile strength | all | 18 MPa | 110 MPa | 220 MPa sound speed | median | 1950 m/s | highest | 2500 m/s (tin) | lowest | 1260 m/s (lead) | distribution | thermal expansion | median | 2.1×10^-5 K^(-1) | highest | 2.89×10^-5 K^(-1) (lead) | lowest | 6.7×10^-6 K^(-1) (praseodymium) | distribution | thermal conductivity | median | 26 W/(m K) | highest | 67 W/(m K) (tin) | lowest | 13 W/(m K) (praseodymium) | distribution | (properties at standard conditions)
Electromagnetic properties
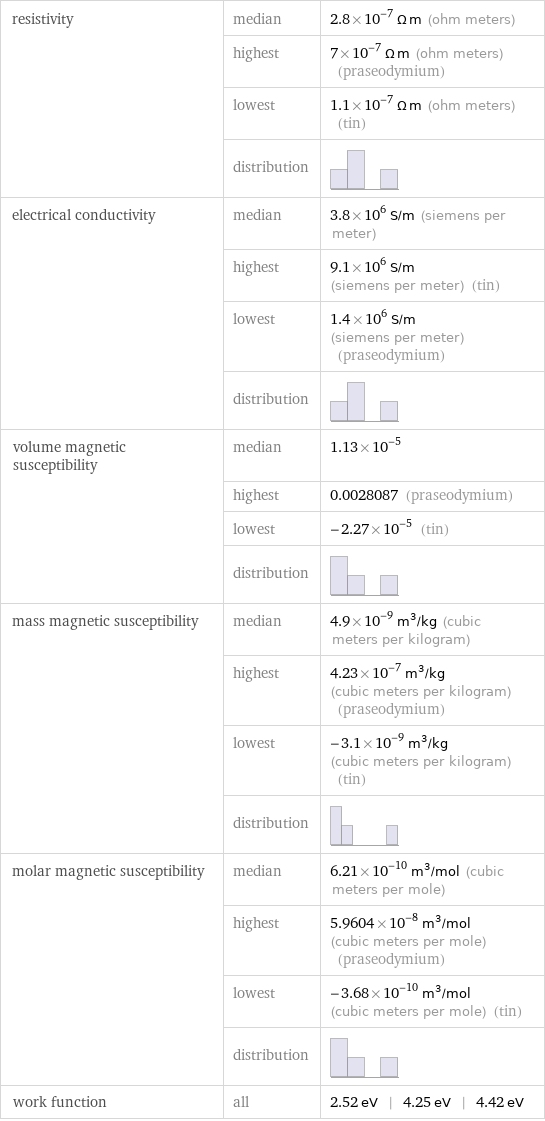
resistivity | median | 2.8×10^-7 Ω m (ohm meters) | highest | 7×10^-7 Ω m (ohm meters) (praseodymium) | lowest | 1.1×10^-7 Ω m (ohm meters) (tin) | distribution | electrical conductivity | median | 3.8×10^6 S/m (siemens per meter) | highest | 9.1×10^6 S/m (siemens per meter) (tin) | lowest | 1.4×10^6 S/m (siemens per meter) (praseodymium) | distribution | volume magnetic susceptibility | median | 1.13×10^-5 | highest | 0.0028087 (praseodymium) | lowest | -2.27×10^-5 (tin) | distribution | mass magnetic susceptibility | median | 4.9×10^-9 m^3/kg (cubic meters per kilogram) | highest | 4.23×10^-7 m^3/kg (cubic meters per kilogram) (praseodymium) | lowest | -3.1×10^-9 m^3/kg (cubic meters per kilogram) (tin) | distribution | molar magnetic susceptibility | median | 6.21×10^-10 m^3/mol (cubic meters per mole) | highest | 5.9604×10^-8 m^3/mol (cubic meters per mole) (praseodymium) | lowest | -3.68×10^-10 m^3/mol (cubic meters per mole) (tin) | distribution | work function | all | 2.52 eV | 4.25 eV | 4.42 eV
Reactivity
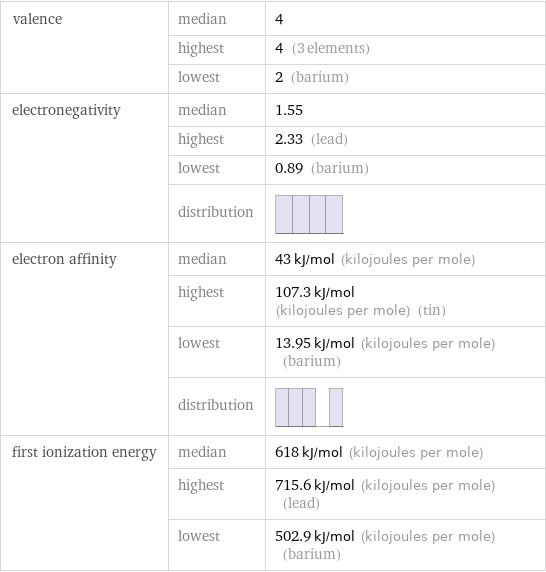
valence | median | 4 | highest | 4 (3 elements) | lowest | 2 (barium) electronegativity | median | 1.55 | highest | 2.33 (lead) | lowest | 0.89 (barium) | distribution | electron affinity | median | 43 kJ/mol (kilojoules per mole) | highest | 107.3 kJ/mol (kilojoules per mole) (tin) | lowest | 13.95 kJ/mol (kilojoules per mole) (barium) | distribution | first ionization energy | median | 618 kJ/mol (kilojoules per mole) | highest | 715.6 kJ/mol (kilojoules per mole) (lead) | lowest | 502.9 kJ/mol (kilojoules per mole) (barium)
Atomic properties
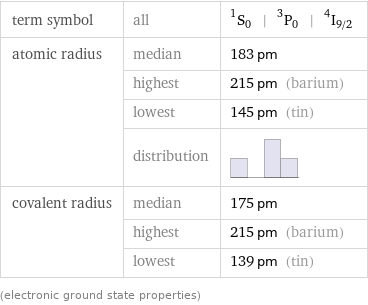
term symbol | all | ^1S_0 | ^3P_0 | ^4I_(9/2) atomic radius | median | 183 pm | highest | 215 pm (barium) | lowest | 145 pm (tin) | distribution | covalent radius | median | 175 pm | highest | 215 pm (barium) | lowest | 139 pm (tin) (electronic ground state properties)
Abundances

universe abundance | median | 7×10^-7 mass% | highest | 1×10^-6 mass% (lead and barium) | lowest | 2×10^-7 mass% (praseodymium) | distribution | solar abundance | median | 9.5×10^-7 mass% | highest | 1×10^-6 mass% (lead and barium) | lowest | 1×10^-7 mass% (praseodymium) | distribution | meteorite abundance | median | 1.3×10^-4 mass% | highest | 2.7×10^-4 mass% (barium) | lowest | 9.8×10^-6 mass% (praseodymium) | distribution | crust abundance | median | 9.3×10^-4 mass% | highest | 0.034 mass% (barium) | lowest | 2.2×10^-4 mass% (tin) ocean abundance | median | 2×10^-9 mass% | highest | 3×10^-6 mass% (barium) | lowest | 6×10^-11 mass% (praseodymium) human abundance | median | 3×10^-5 mass% | highest | 1.7×10^-4 mass% (lead) | lowest | 2×10^-5 mass% (tin) universe molar abundance | median | 5×10^-9 mol% | highest | 9×10^-9 mol% (barium) | lowest | 2×10^-9 mol% (praseodymium) | distribution | solar molar abundance | median | 8.5×10^-9 mol% | highest | 9.9×10^-9 mol% (tin and barium) | lowest | 5×10^-10 mol% (praseodymium) | distribution | meteorite molar abundance | median | 1.4×10^-5 mol% | highest | 4.1×10^-5 mol% (barium) | lowest | 1×10^-6 mol% (praseodymium) | distribution | ocean molar abundance | median | 7.1×10^-11 mol% | highest | 1.4×10^-7 mol% (barium) | lowest | 2.6×10^-12 mol% (praseodymium) crust molar abundance | median | 1.1×10^-4 mol% | highest | 0.0051 mol% (barium) | lowest | 3.8×10^-5 mol% (tin) human molar abundance | median | 1.4×10^-6 mol% | highest | 5×10^-6 mol% (lead) | lowest | 1.1×10^-6 mol% (tin)